| Param | Original file | Final file |
|---|---|---|
| Filename | modeM0/AS1A04_026T01_9000002342cztM0_level2_bc.evt | modeM0/AS1A04_026T01_9000002342cztM0_level2_quad_clean.evt |
| Size (bytes) | 2,189,531,520 | 751,245,120 |
| Size | 2.0 GB | 716.4 MB |
| Events in quadrant A | 15,300,009 | 4,640,183 |
| Events in quadrant B | 23,472,719 | 4,742,323 |
| Events in quadrant C | 11,688,567 | 4,772,424 |
| Events in quadrant D | 11,979,957 | 4,704,672 |
| Mode M0 | |||
|---|---|---|---|
| Quadrant | BADHDUFLAG | Total packets | Discarded packets |
| A | 0 | 132726 | 0 |
| B | 0 | 157274 | 0 |
| C | 0 | 119018 | 0 |
| D | 0 | 118492 | 0 |
| Mode M9 | |||
|---|---|---|---|
| Quadrant | BADHDUFLAG | Total packets | Discarded packets |
| A | 0 | 84 | 0 |
| B | 0 | 84 | 0 |
| C | 0 | 84 | 0 |
| D | 0 | 84 | 0 |
| Mode SS | |||
|---|---|---|---|
| Quadrant | BADHDUFLAG | Total packets | Discarded packets |
| A | 0 | 1158 | 0 |
| B | 0 | 1158 | 0 |
| C | 0 | 1158 | 0 |
| D | 0 | 1158 | 0 |
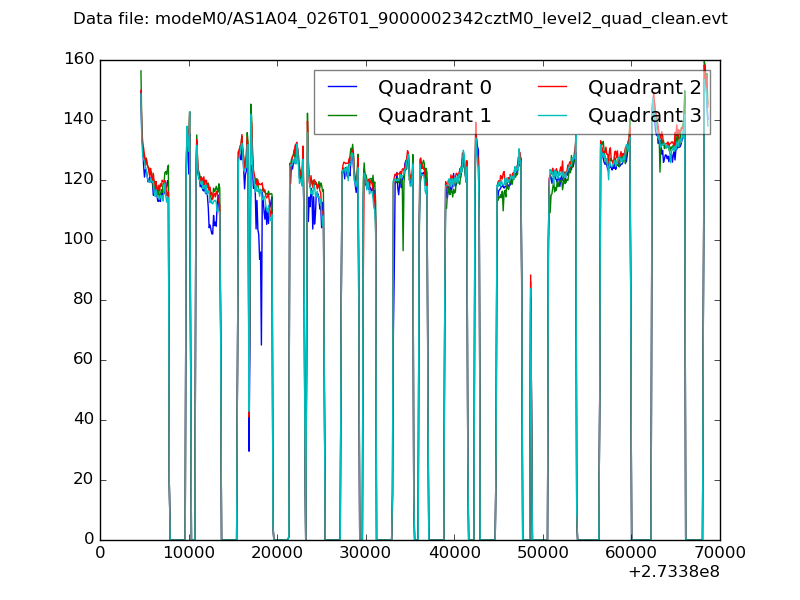
| Quadrant | Total seconds | Saturated seconds | Saturation percentage |
|---|---|---|---|
| A | 56772 | 1925 | 3.390756% |
| B | 56772 | 2090 | 3.681392% |
| C | 56772 | 974 | 1.715634% |
| D | 56772 | 589 | 1.037483% |
Noise dominated data is calculated using 1-second bins in cleaned event files. If a bin has >2000 counts, and if more than 50% of those come from <1% of pixels, then it is considered to be noise-dominated and hence unusable.
| Quadrant | # 1 sec bins | Bins with >0 counts | Bins with >2000 counts | High rate bins dominated by noise | Noise dominated (total time) | Noise dominated (detector-on time) | Marked lightcurve |
|---|---|---|---|---|---|---|---|
| A | 65203 | 56776 | 151 | 151 | 0.23% | 0.27% | 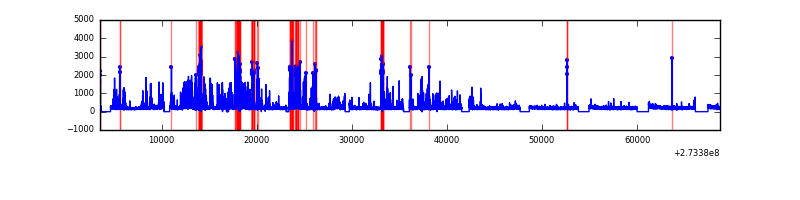 |
| B | 65203 | 56774 | 46 | 46 | 0.07% | 0.08% |  |
| C | 65203 | 56777 | 6 | 6 | 0.01% | 0.01% |  |
| D | 65203 | 56780 | 19 | 19 | 0.03% | 0.03% | 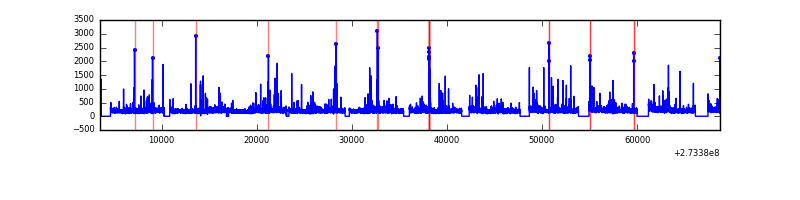 |
Top three noisy pixels from each quadrant. If the there are fewer than three noisy pixels in the level2.evt file, extra rows are filled as -1
| Pixel properties | Quadrant properties | ||||||
|---|---|---|---|---|---|---|---|
| Quadrant | DetID | PixID | Counts | Sigma | Mean | Median | Sigma |
| A | 15 | 239 | 4133671 | 6664.43 | 2838 | 2783 | 619.8 |
| A | 13 | 210 | 71715 | 111.21 | 2838 | 2783 | 619.8 |
| A | 13 | 248 | 56388 | 86.48 | 2838 | 2783 | 619.8 |
| B | 5 | 65 | 9581689 | 17556.73 | 2880 | 2809 | 545.6 |
| B | 7 | 220 | 472794 | 861.42 | 2880 | 2809 | 545.6 |
| B | 10 | 245 | 454711 | 828.27 | 2880 | 2809 | 545.6 |
| C | 3 | 233 | 372352 | 560.83 | 2829 | 2817 | 658.9 |
| C | 9 | 54 | 197578 | 295.58 | 2829 | 2817 | 658.9 |
| C | 10 | 22 | 115357 | 170.8 | 2829 | 2817 | 658.9 |
| D | 2 | 152 | 291382 | 395.92 | 2865 | 2778 | 728.9 |
| D | 2 | 234 | 236489 | 320.62 | 2865 | 2778 | 728.9 |
| D | 13 | 172 | 143996 | 193.73 | 2865 | 2778 | 728.9 |
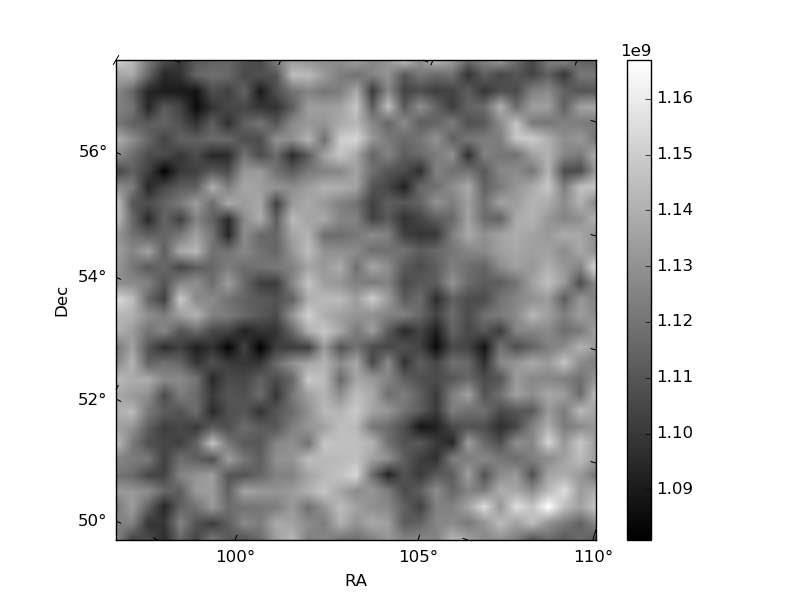
Histogram calculated using DETX and DETY for each event in the final _common_clean file
| Quadrant A | 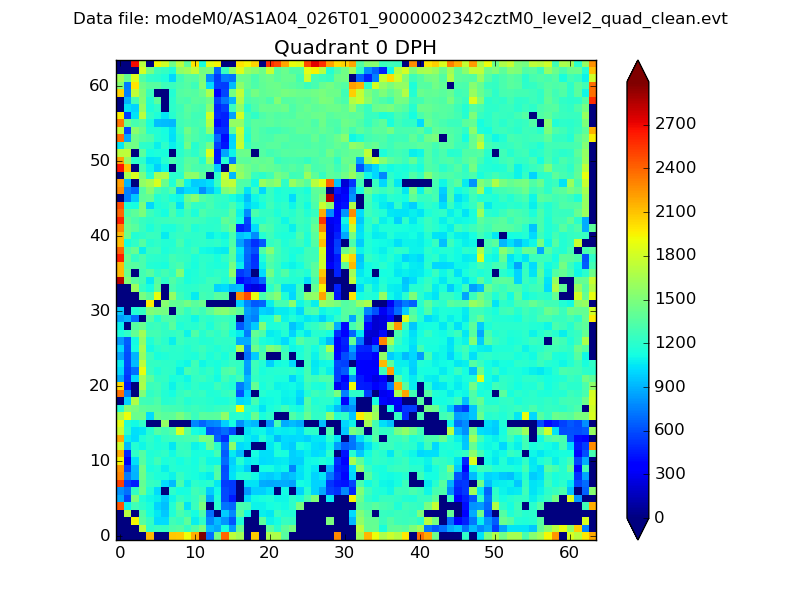 |
 |
Quadrant B |
|---|---|---|---|
| Quadrant D |  |
 |
Quadrant C |
| Plot type | Count rate plots | Images |
|---|---|---|
| Comparison with Poisson distribution Blue bars denote a histogram of data divided into 1 sec bins. Red curve is a Poisson curve with rate = median count rate of data. |
 |
 |
| Quadrant-wise count rates Data is divided into 100 sec bins |
 |
|
| Module-wise count rates for Quadrant A Data is divided into 100 sec bins |
 |
 |
| Module-wise count rates for Quadrant B Data is divided into 100 sec bins |
 |
 |
| Module-wise count rates for Quadrant C Data is divided into 100 sec bins |
 |
 |
| Module-wise count rates for Quadrant D Data is divided into 100 sec bins |
 |
 |
| Parameter | Plot |
|---|---|
| CZT HV Monitor |  |
| D_VDD |  |
| Temperature 1 |  |
| Veto HV Monitor | 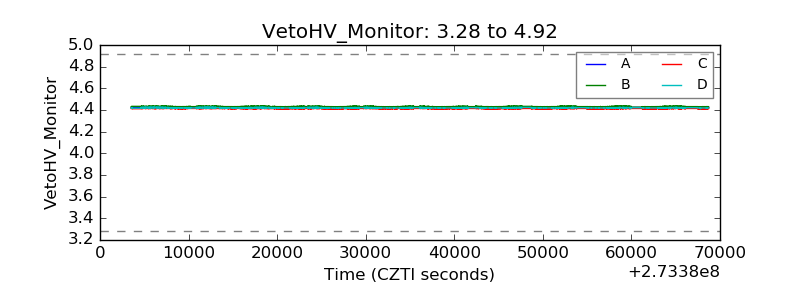 |
| Veto LLD |  |
| Alpha Counter |  |
| _CPM_Rate |  |
| CZT Counter | 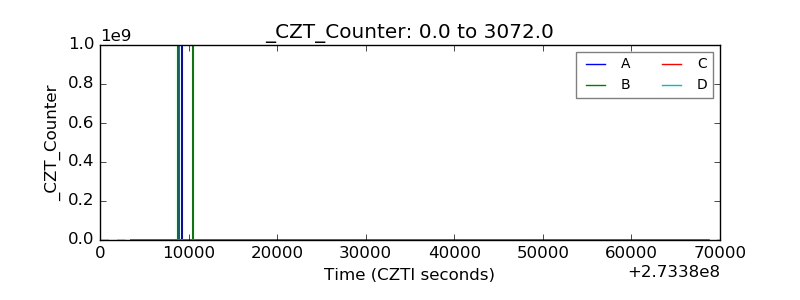 |
| +2.5 Volts monitor |  |
| +5 Volts monitor | 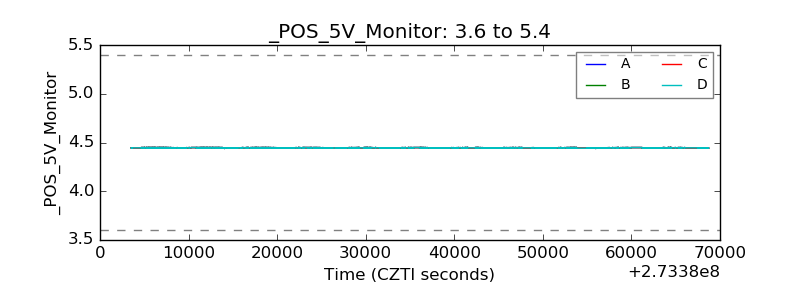 |
| _ROLL_ROT |  |
| _Roll_DEC |  |
| _Roll_RA |  |
| Veto Counter |  |