| Param | Original file | Final file |
|---|---|---|
| Filename | modeM0/AS1T02_097T01_9000002340cztM0_level2_bc.evt | modeM0/AS1T02_097T01_9000002340cztM0_level2_quad_clean.evt |
| Size (bytes) | 853,274,880 | 311,135,040 |
| Size | 813.7 MB | 296.7 MB |
| Events in quadrant A | 6,472,102 | 1,918,793 |
| Events in quadrant B | 5,804,072 | 2,003,927 |
| Events in quadrant C | 5,334,395 | 1,941,571 |
| Events in quadrant D | 6,561,755 | 1,879,932 |
| Mode M0 | |||
|---|---|---|---|
| Quadrant | BADHDUFLAG | Total packets | Discarded packets |
| A | 0 | 56668 | 0 |
| B | 0 | 52191 | 0 |
| C | 0 | 51090 | 0 |
| D | 0 | 54054 | 0 |
| Mode M9 | |||
|---|---|---|---|
| Quadrant | BADHDUFLAG | Total packets | Discarded packets |
| A | 0 | 64 | 0 |
| B | 0 | 64 | 0 |
| C | 0 | 64 | 0 |
| D | 0 | 64 | 0 |
| Mode SS | |||
|---|---|---|---|
| Quadrant | BADHDUFLAG | Total packets | Discarded packets |
| A | 0 | 498 | 0 |
| B | 0 | 498 | 0 |
| C | 0 | 498 | 0 |
| D | 0 | 498 | 0 |
| Quadrant | Total seconds | Saturated seconds | Saturation percentage |
|---|---|---|---|
| A | 24414 | 633 | 2.592775% |
| B | 24414 | 164 | 0.671746% |
| C | 24414 | 197 | 0.806914% |
| D | 24414 | 269 | 1.101827% |
Noise dominated data is calculated using 1-second bins in cleaned event files. If a bin has >2000 counts, and if more than 50% of those come from <1% of pixels, then it is considered to be noise-dominated and hence unusable.
| Quadrant | # 1 sec bins | Bins with >0 counts | Bins with >2000 counts | High rate bins dominated by noise | Noise dominated (total time) | Noise dominated (detector-on time) | Marked lightcurve |
|---|---|---|---|---|---|---|---|
| A | 30815 | 24413 | 25 | 25 | 0.08% | 0.10% |  |
| B | 30815 | 24416 | 3 | 3 | 0.01% | 0.01% |  |
| C | 30815 | 24415 | 0 | 0 | 0.00% | 0.00% |  |
| D | 30815 | 24416 | 122 | 122 | 0.40% | 0.50% | 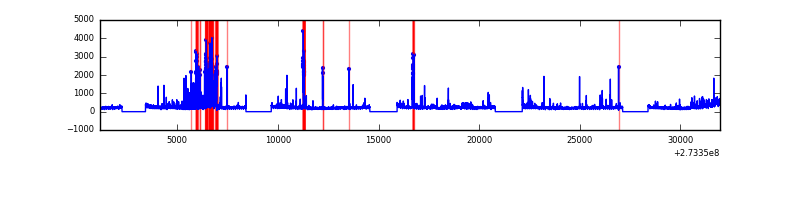 |
Top three noisy pixels from each quadrant. If the there are fewer than three noisy pixels in the level2.evt file, extra rows are filled as -1
| Pixel properties | Quadrant properties | ||||||
|---|---|---|---|---|---|---|---|
| Quadrant | DetID | PixID | Counts | Sigma | Mean | Median | Sigma |
| A | 15 | 239 | 1290754 | 4507.5 | 1325 | 1303 | 286.1 |
| A | 14 | 254 | 26553 | 88.27 | 1325 | 1303 | 286.1 |
| A | 10 | 253 | 23424 | 77.33 | 1325 | 1303 | 286.1 |
| B | 4 | 173 | 164713 | 644.37 | 1368 | 1336 | 253.5 |
| B | 0 | 229 | 71994 | 278.68 | 1368 | 1336 | 253.5 |
| B | 0 | 219 | 55689 | 214.37 | 1368 | 1336 | 253.5 |
| C | 7 | 247 | 175171 | 574.72 | 1308 | 1305 | 302.5 |
| C | 15 | 127 | 56634 | 182.89 | 1308 | 1305 | 302.5 |
| C | 10 | 22 | 50490 | 162.58 | 1308 | 1305 | 302.5 |
| D | 7 | 223 | 1002093 | 3357.21 | 1313 | 1269 | 298.1 |
| D | 12 | 144 | 255318 | 852.19 | 1313 | 1269 | 298.1 |
| D | 2 | 234 | 96051 | 317.94 | 1313 | 1269 | 298.1 |
Histogram calculated using DETX and DETY for each event in the final _common_clean file
| Quadrant A | 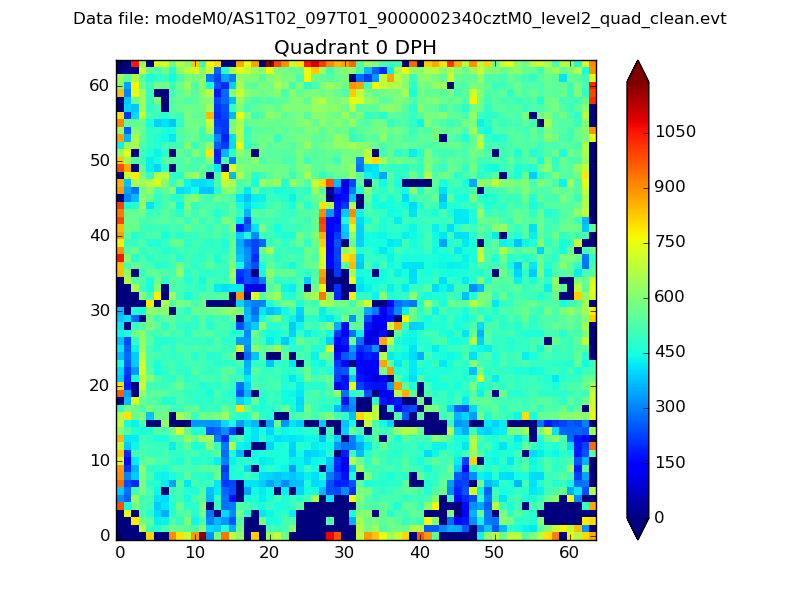 |
 |
Quadrant B |
|---|---|---|---|
| Quadrant D |  |
 |
Quadrant C |
| Plot type | Count rate plots | Images |
|---|---|---|
| Comparison with Poisson distribution Blue bars denote a histogram of data divided into 1 sec bins. Red curve is a Poisson curve with rate = median count rate of data. |
 |
 |
| Quadrant-wise count rates Data is divided into 100 sec bins |
 |
|
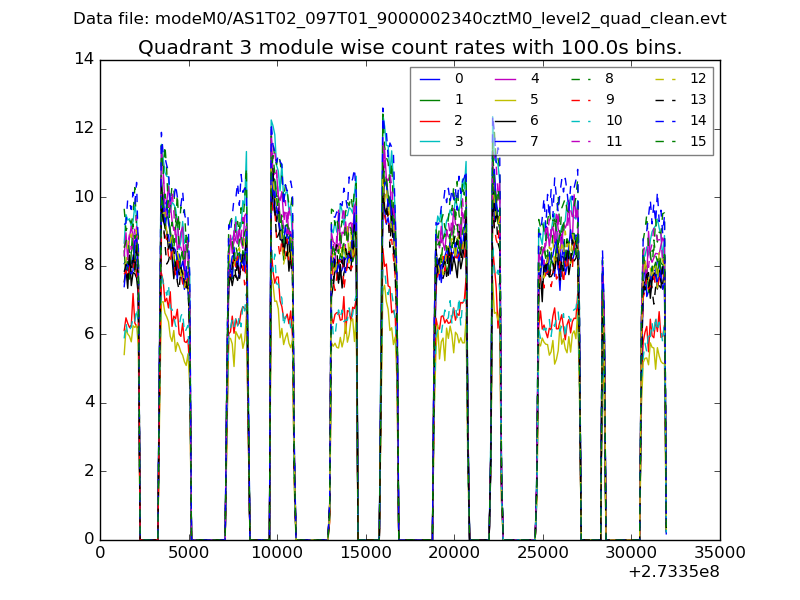
| Module-wise count rates for Quadrant A Data is divided into 100 sec bins |
 |
 |
| Module-wise count rates for Quadrant B Data is divided into 100 sec bins |
 |
 |
| Module-wise count rates for Quadrant C Data is divided into 100 sec bins |
 |
 |
| Module-wise count rates for Quadrant D Data is divided into 100 sec bins |
 |
 |
| Parameter | Plot |
|---|---|
| CZT HV Monitor | 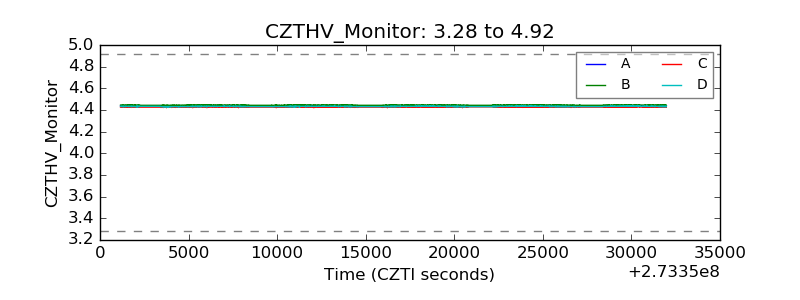 |
| D_VDD |  |
| Temperature 1 |  |
| Veto HV Monitor | 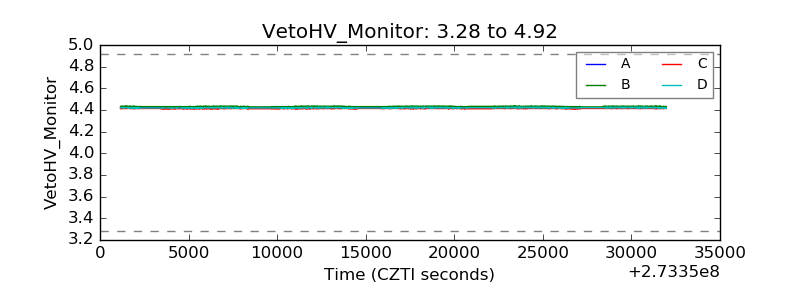 |
| Veto LLD |  |
| Alpha Counter |  |
| _CPM_Rate |  |
| CZT Counter |  |
| +2.5 Volts monitor |  |
| +5 Volts monitor |  |
| _ROLL_ROT |  |
| _Roll_DEC |  |
| _Roll_RA |  |
| Veto Counter |  |