| Param | Original file | Final file |
|---|---|---|
| Filename | modeM0/AS1T02_058T01_9000002338cztM0_level2_bc.evt | modeM0/AS1T02_058T01_9000002338cztM0_level2_quad_clean.evt |
| Size (bytes) | 881,035,200 | 333,564,480 |
| Size | 840.2 MB | 318.1 MB |
| Events in quadrant A | 7,184,778 | 2,107,223 |
| Events in quadrant B | 6,494,953 | 2,144,974 |
| Events in quadrant C | 5,574,447 | 2,060,255 |
| Events in quadrant D | 5,677,845 | 2,030,366 |
| Mode SS | |||
|---|---|---|---|
| Quadrant | BADHDUFLAG | Total packets | Discarded packets |
| A | 0 | 526 | 0 |
| B | 0 | 526 | 0 |
| C | 0 | 526 | 0 |
| D | 0 | 526 | 0 |
| Mode M0 | |||
|---|---|---|---|
| Quadrant | BADHDUFLAG | Total packets | Discarded packets |
| A | 0 | 61597 | 0 |
| B | 0 | 56794 | 0 |
| C | 0 | 53905 | 0 |
| D | 0 | 53644 | 0 |
| Mode M9 | |||
|---|---|---|---|
| Quadrant | BADHDUFLAG | Total packets | Discarded packets |
| A | 0 | 34 | 0 |
| B | 0 | 34 | 0 |
| C | 0 | 34 | 0 |
| D | 0 | 34 | 0 |
| Quadrant | Total seconds | Saturated seconds | Saturation percentage |
|---|---|---|---|
| A | 25576 | 1194 | 4.668439% |
| B | 25577 | 402 | 1.571725% |
| C | 25577 | 383 | 1.497439% |
| D | 25577 | 281 | 1.098643% |
Noise dominated data is calculated using 1-second bins in cleaned event files. If a bin has >2000 counts, and if more than 50% of those come from <1% of pixels, then it is considered to be noise-dominated and hence unusable.
| Quadrant | # 1 sec bins | Bins with >0 counts | Bins with >2000 counts | High rate bins dominated by noise | Noise dominated (total time) | Noise dominated (detector-on time) | Marked lightcurve |
|---|---|---|---|---|---|---|---|
| A | 29153 | 25573 | 65 | 65 | 0.22% | 0.25% | 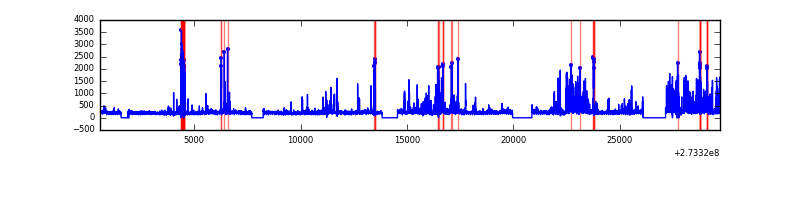 |
| B | 29153 | 25578 | 9 | 9 | 0.03% | 0.04% |  |
| C | 29153 | 25581 | 4 | 4 | 0.01% | 0.02% |  |
| D | 29153 | 25578 | 6 | 6 | 0.02% | 0.02% |  |
Top three noisy pixels from each quadrant. If the there are fewer than three noisy pixels in the level2.evt file, extra rows are filled as -1
| Pixel properties | Quadrant properties | ||||||
|---|---|---|---|---|---|---|---|
| Quadrant | DetID | PixID | Counts | Sigma | Mean | Median | Sigma |
| A | 15 | 239 | 1750272 | 5732.8 | 1331 | 1300 | 305.1 |
| A | 14 | 254 | 175754 | 571.83 | 1331 | 1300 | 305.1 |
| A | 10 | 253 | 99118 | 320.63 | 1331 | 1300 | 305.1 |
| B | 7 | 220 | 333689 | 1257.28 | 1367 | 1340 | 264.3 |
| B | 10 | 245 | 191902 | 720.9 | 1367 | 1340 | 264.3 |
| B | 0 | 229 | 142007 | 532.14 | 1367 | 1340 | 264.3 |
| C | 7 | 247 | 442657 | 1417.67 | 1309 | 1306 | 311.3 |
| C | 10 | 22 | 40350 | 125.41 | 1309 | 1306 | 311.3 |
| C | 0 | 207 | 21946 | 66.3 | 1309 | 1306 | 311.3 |
| D | 1 | 52 | 156745 | 444.14 | 1331 | 1288 | 350.0 |
| D | 2 | 234 | 112294 | 317.14 | 1331 | 1288 | 350.0 |
| D | 2 | 152 | 102361 | 288.76 | 1331 | 1288 | 350.0 |
Histogram calculated using DETX and DETY for each event in the final _common_clean file
| Quadrant A |  |
 |
Quadrant B |
|---|---|---|---|
| Quadrant D |  |
 |
Quadrant C |
| Plot type | Count rate plots | Images |
|---|---|---|
| Comparison with Poisson distribution Blue bars denote a histogram of data divided into 1 sec bins. Red curve is a Poisson curve with rate = median count rate of data. |
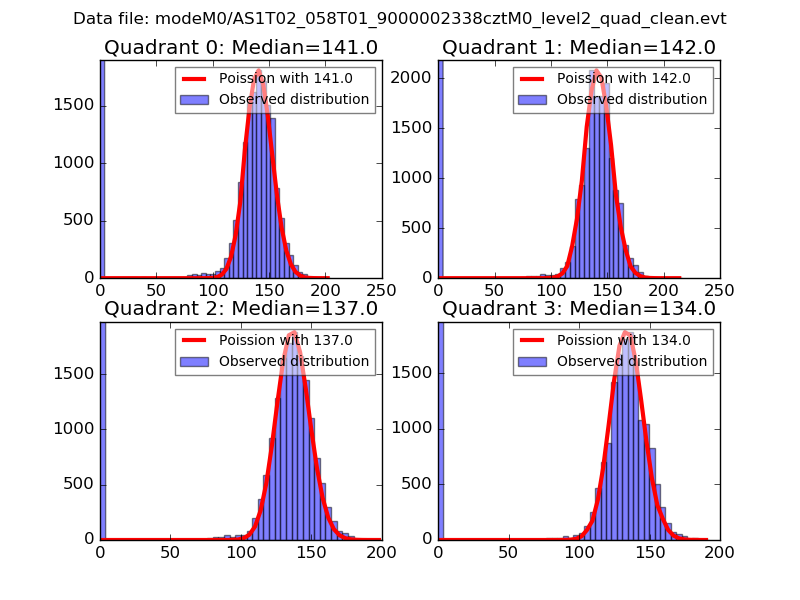 |
 |
| Quadrant-wise count rates Data is divided into 100 sec bins |
 |
|
| Module-wise count rates for Quadrant A Data is divided into 100 sec bins |
 |
 |
| Module-wise count rates for Quadrant B Data is divided into 100 sec bins |
 |
 |
| Module-wise count rates for Quadrant C Data is divided into 100 sec bins |
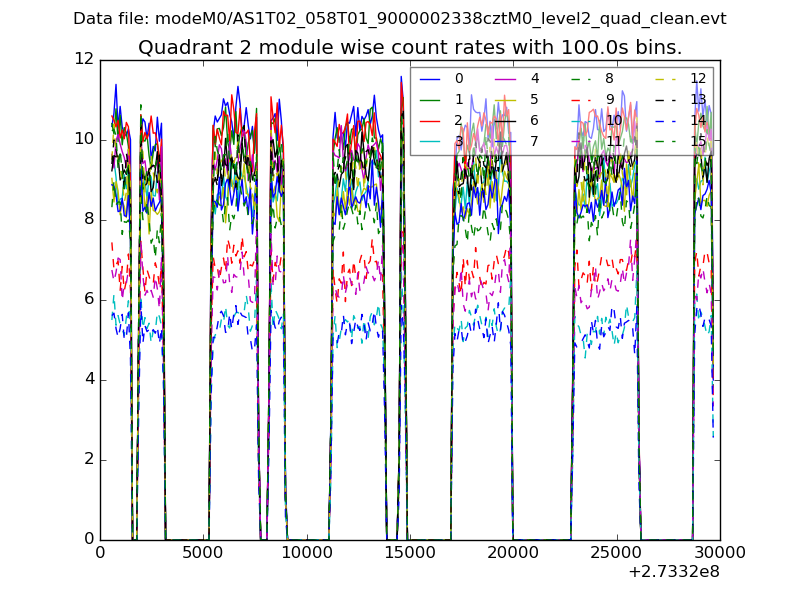 |
 |
| Module-wise count rates for Quadrant D Data is divided into 100 sec bins |
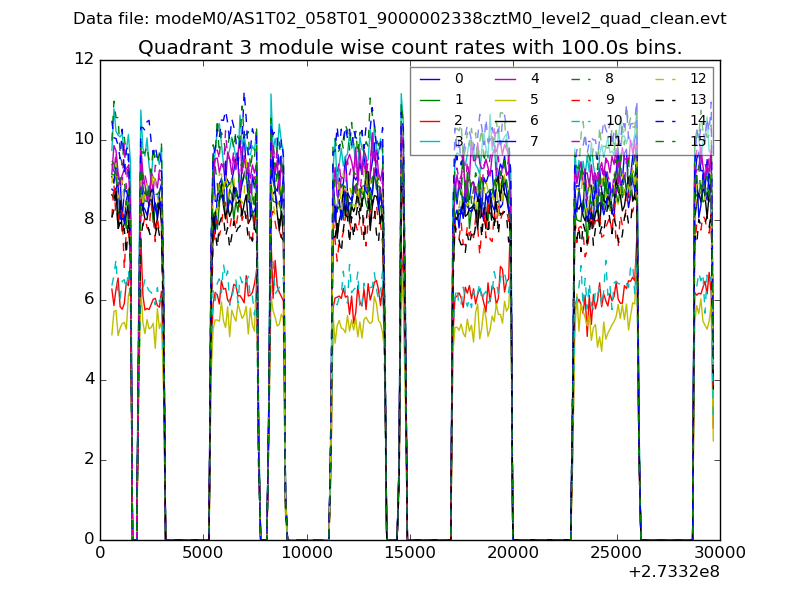 |
 |
| Parameter | Plot |
|---|---|
| CZT HV Monitor | 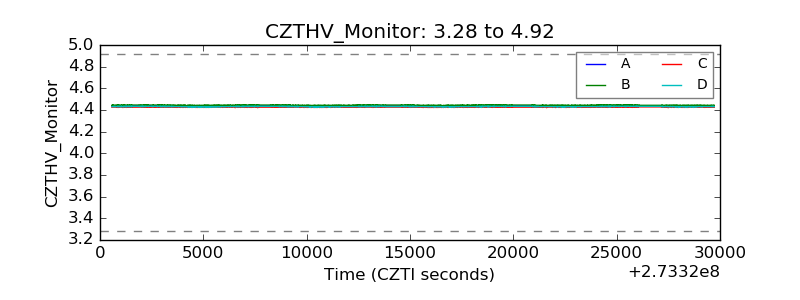 |
| D_VDD |  |
| Temperature 1 |  |
| Veto HV Monitor |  |
| Veto LLD | 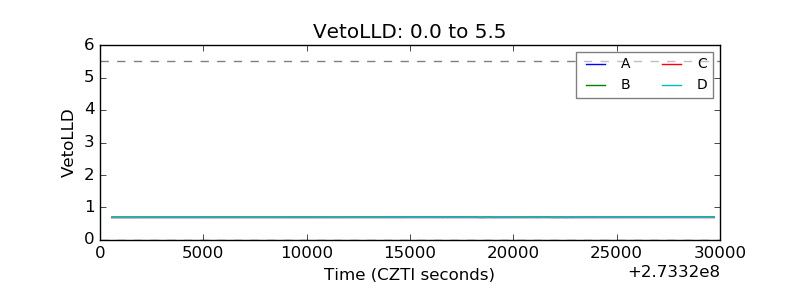 |
| Alpha Counter | 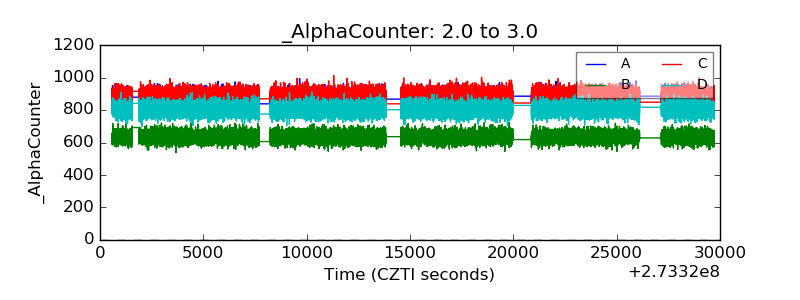 |
| _CPM_Rate | 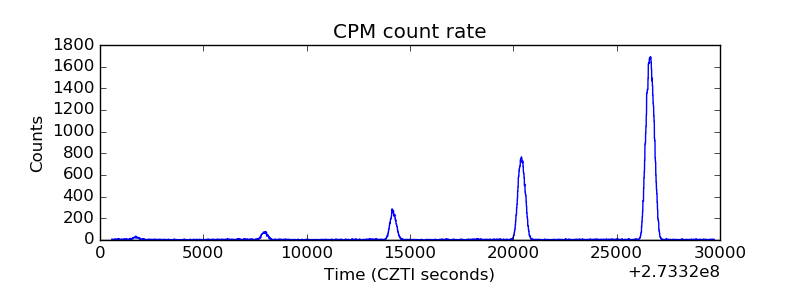 |
| CZT Counter |  |
| +2.5 Volts monitor |  |
| +5 Volts monitor |  |
| _ROLL_ROT |  |
| _Roll_DEC | 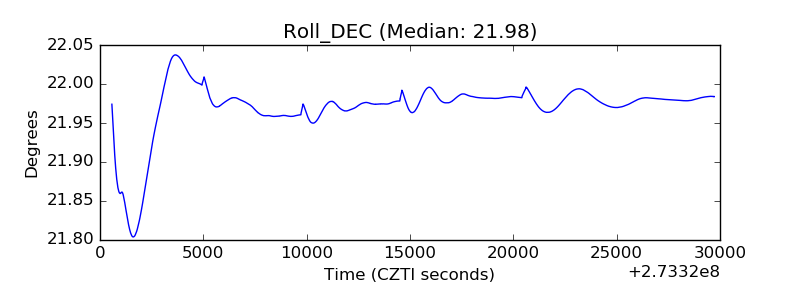 |
| _Roll_RA |  |
| Veto Counter |  |