| Param | Original file | Final file |
|---|---|---|
| Filename | modeM0/AS1G08_028T01_9000002334cztM0_level2_bc.evt | modeM0/AS1G08_028T01_9000002334cztM0_level2_quad_clean.evt |
| Size (bytes) | 995,656,320 | 406,071,360 |
| Size | 949.5 MB | 387.3 MB |
| Events in quadrant A | 6,393,576 | 2,549,260 |
| Events in quadrant B | 7,019,897 | 2,618,037 |
| Events in quadrant C | 6,412,991 | 2,486,211 |
| Events in quadrant D | 8,121,674 | 2,429,694 |
| Mode M9 | |||
|---|---|---|---|
| Quadrant | BADHDUFLAG | Total packets | Discarded packets |
| A | 0 | 42 | 0 |
| B | 0 | 42 | 0 |
| C | 0 | 42 | 0 |
| D | 0 | 42 | 0 |
| Mode SS | |||
|---|---|---|---|
| Quadrant | BADHDUFLAG | Total packets | Discarded packets |
| A | 0 | 656 | 0 |
| B | 0 | 656 | 0 |
| C | 0 | 656 | 0 |
| D | 0 | 656 | 0 |
| Mode M0 | |||
|---|---|---|---|
| Quadrant | BADHDUFLAG | Total packets | Discarded packets |
| A | 0 | 66606 | 0 |
| B | 0 | 67835 | 0 |
| C | 0 | 66812 | 0 |
| D | 0 | 71219 | 0 |
| Quadrant | Total seconds | Saturated seconds | Saturation percentage |
|---|---|---|---|
| A | 32258 | 617 | 1.912704% |
| B | 32258 | 731 | 2.266105% |
| C | 32258 | 701 | 2.173104% |
| D | 32258 | 683 | 2.117304% |
Noise dominated data is calculated using 1-second bins in cleaned event files. If a bin has >2000 counts, and if more than 50% of those come from <1% of pixels, then it is considered to be noise-dominated and hence unusable.
| Quadrant | # 1 sec bins | Bins with >0 counts | Bins with >2000 counts | High rate bins dominated by noise | Noise dominated (total time) | Noise dominated (detector-on time) | Marked lightcurve |
|---|---|---|---|---|---|---|---|
| A | 36389 | 32261 | 0 | 0 | 0.00% | 0.00% |  |
| B | 36389 | 32261 | 0 | 0 | 0.00% | 0.00% |  |
| C | 36389 | 32260 | 1 | 1 | 0.00% | 0.00% |  |
| D | 36389 | 32261 | 104 | 104 | 0.29% | 0.32% | 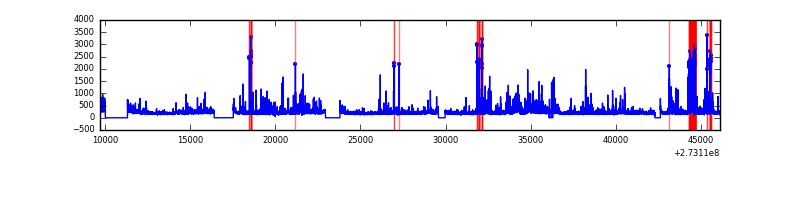 |
Top three noisy pixels from each quadrant. If the there are fewer than three noisy pixels in the level2.evt file, extra rows are filled as -1
| Pixel properties | Quadrant properties | ||||||
|---|---|---|---|---|---|---|---|
| Quadrant | DetID | PixID | Counts | Sigma | Mean | Median | Sigma |
| A | 9 | 143 | 33527 | 88.96 | 1642 | 1605 | 358.9 |
| A | 15 | 239 | 28428 | 74.75 | 1642 | 1605 | 358.9 |
| A | 13 | 254 | 11746 | 28.26 | 1642 | 1605 | 358.9 |
| B | 3 | 209 | 147474 | 464.93 | 1676 | 1633 | 313.7 |
| B | 3 | 64 | 119714 | 376.43 | 1676 | 1633 | 313.7 |
| B | 4 | 216 | 54373 | 168.13 | 1676 | 1633 | 313.7 |
| C | 3 | 233 | 129423 | 340.66 | 1598 | 1590 | 375.2 |
| C | 7 | 247 | 73861 | 192.6 | 1598 | 1590 | 375.2 |
| C | 15 | 127 | 42336 | 108.58 | 1598 | 1590 | 375.2 |
| D | 1 | 52 | 1569721 | 3796.17 | 1604 | 1560 | 413.1 |
| D | 10 | 70 | 132591 | 317.2 | 1604 | 1560 | 413.1 |
| D | 2 | 234 | 120004 | 286.73 | 1604 | 1560 | 413.1 |
Histogram calculated using DETX and DETY for each event in the final _common_clean file
| Quadrant A | 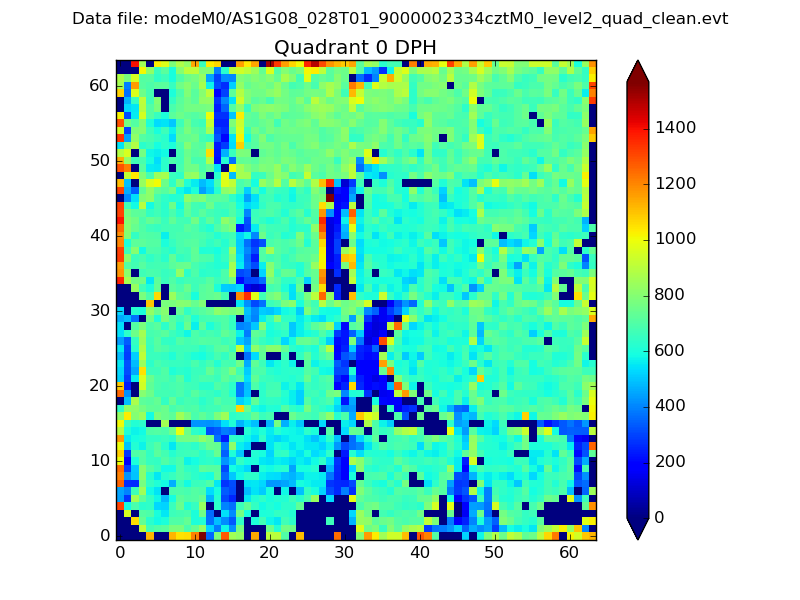 |
 |
Quadrant B |
|---|---|---|---|
| Quadrant D |  |
 |
Quadrant C |
| Plot type | Count rate plots | Images |
|---|---|---|
| Comparison with Poisson distribution Blue bars denote a histogram of data divided into 1 sec bins. Red curve is a Poisson curve with rate = median count rate of data. |
 |
 |
| Quadrant-wise count rates Data is divided into 100 sec bins |
 |
|
| Module-wise count rates for Quadrant A Data is divided into 100 sec bins |
 |
 |
| Module-wise count rates for Quadrant B Data is divided into 100 sec bins |
 |
 |
| Module-wise count rates for Quadrant C Data is divided into 100 sec bins |
 |
 |
| Module-wise count rates for Quadrant D Data is divided into 100 sec bins |
 |
 |
| Parameter | Plot |
|---|---|
| CZT HV Monitor |  |
| D_VDD | 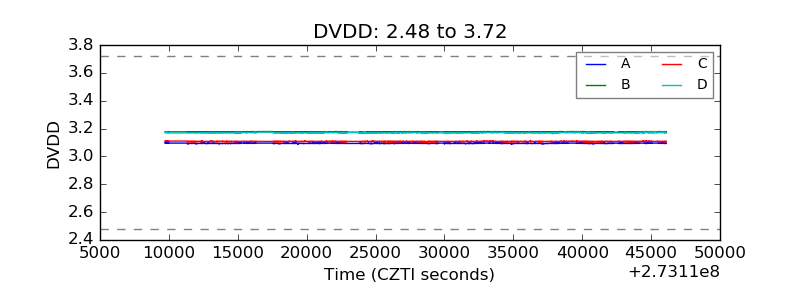 |
| Temperature 1 |  |
| Veto HV Monitor |  |
| Veto LLD |  |
| Alpha Counter |  |
| _CPM_Rate |  |
| CZT Counter | 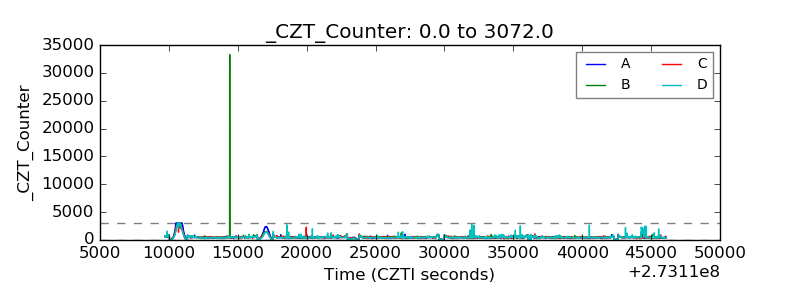 |
| +2.5 Volts monitor |  |
| +5 Volts monitor | 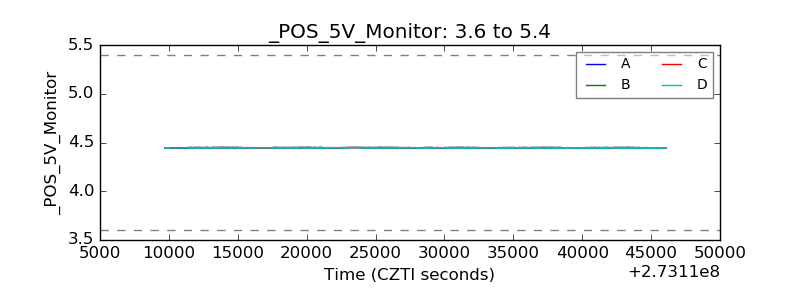 |
| _ROLL_ROT |  |
| _Roll_DEC |  |
| _Roll_RA |  |
| Veto Counter |  |