| Param | Original file | Final file |
|---|---|---|
| Filename | modeM0/AS1A04_100T01_9000002336cztM0_level2_bc.evt | modeM0/AS1A04_100T01_9000002336cztM0_level2_quad_clean.evt |
| Size (bytes) | 4,378,296,960 | 1,892,376,000 |
| Size | 4.1 GB | 1.8 GB |
| Events in quadrant A | 29,066,973 | 11,858,542 |
| Events in quadrant B | 34,516,949 | 12,120,379 |
| Events in quadrant C | 28,256,960 | 12,014,455 |
| Events in quadrant D | 31,199,479 | 11,720,270 |
| Mode SS | |||
|---|---|---|---|
| Quadrant | BADHDUFLAG | Total packets | Discarded packets |
| A | 0 | 2854 | 0 |
| B | 0 | 2854 | 0 |
| C | 0 | 2854 | 0 |
| D | 0 | 2854 | 0 |
| Mode M0 | |||
|---|---|---|---|
| Quadrant | BADHDUFLAG | Total packets | Discarded packets |
| A | 0 | 293511 | 0 |
| B | 0 | 310022 | 0 |
| C | 0 | 292738 | 0 |
| D | 0 | 296782 | 0 |
| Mode M9 | |||
|---|---|---|---|
| Quadrant | BADHDUFLAG | Total packets | Discarded packets |
| A | 0 | 224 | 0 |
| B | 0 | 224 | 0 |
| C | 0 | 224 | 0 |
| D | 0 | 224 | 0 |
| Quadrant | Total seconds | Saturated seconds | Saturation percentage |
|---|---|---|---|
| A | 140218 | 1949 | 1.389978% |
| B | 140218 | 2588 | 1.845697% |
| C | 140218 | 2291 | 1.633884% |
| D | 140218 | 1624 | 1.158197% |
Noise dominated data is calculated using 1-second bins in cleaned event files. If a bin has >2000 counts, and if more than 50% of those come from <1% of pixels, then it is considered to be noise-dominated and hence unusable.
| Quadrant | # 1 sec bins | Bins with >0 counts | Bins with >2000 counts | High rate bins dominated by noise | Noise dominated (total time) | Noise dominated (detector-on time) | Marked lightcurve |
|---|---|---|---|---|---|---|---|
| A | 162774 | 140225 | 85 | 85 | 0.05% | 0.06% |  |
| B | 162774 | 140221 | 153 | 153 | 0.09% | 0.11% |  |
| C | 162774 | 140223 | 0 | 0 | 0.00% | 0.00% |  |
| D | 162774 | 140225 | 64 | 64 | 0.04% | 0.05% |  |
Top three noisy pixels from each quadrant. If the there are fewer than three noisy pixels in the level2.evt file, extra rows are filled as -1
| Pixel properties | Quadrant properties | ||||||
|---|---|---|---|---|---|---|---|
| Quadrant | DetID | PixID | Counts | Sigma | Mean | Median | Sigma |
| A | 15 | 239 | 1052015 | 677.45 | 7142 | 7009 | 1542.6 |
| A | 14 | 254 | 148010 | 91.41 | 7142 | 7009 | 1542.6 |
| A | 9 | 143 | 129336 | 79.3 | 7142 | 7009 | 1542.6 |
| B | 10 | 245 | 875966 | 641.58 | 7264 | 7076 | 1354.3 |
| B | 3 | 209 | 849460 | 622.01 | 7264 | 7076 | 1354.3 |
| B | 5 | 65 | 847438 | 620.51 | 7264 | 7076 | 1354.3 |
| C | 7 | 247 | 534377 | 320.01 | 7054 | 7010 | 1648.0 |
| C | 3 | 233 | 237298 | 139.74 | 7054 | 7010 | 1648.0 |
| C | 10 | 22 | 118905 | 67.9 | 7054 | 7010 | 1648.0 |
| D | 1 | 52 | 1096196 | 606.39 | 7118 | 6910 | 1796.3 |
| D | 2 | 234 | 580090 | 319.08 | 7118 | 6910 | 1796.3 |
| D | 5 | 51 | 413796 | 226.51 | 7118 | 6910 | 1796.3 |
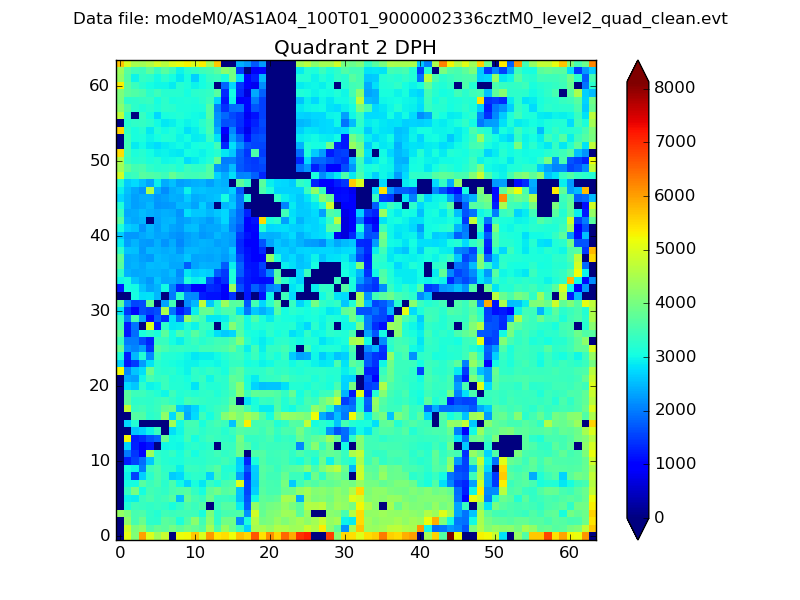
Histogram calculated using DETX and DETY for each event in the final _common_clean file
| Quadrant A |  |
 |
Quadrant B |
|---|---|---|---|
| Quadrant D |  |
 |
Quadrant C |
| Plot type | Count rate plots | Images |
|---|---|---|
| Comparison with Poisson distribution Blue bars denote a histogram of data divided into 1 sec bins. Red curve is a Poisson curve with rate = median count rate of data. |
 |
 |
| Quadrant-wise count rates Data is divided into 100 sec bins |
 |
|
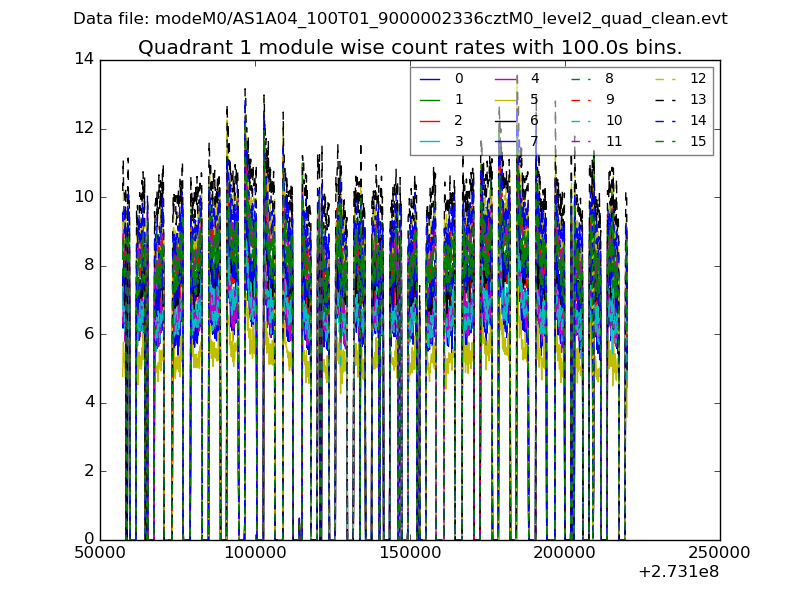
| Module-wise count rates for Quadrant A Data is divided into 100 sec bins |
 |
 |
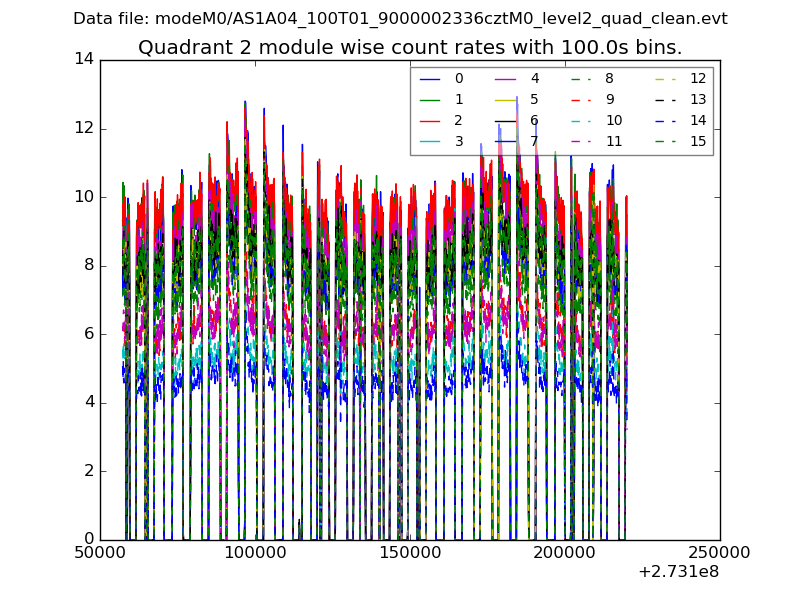
| Module-wise count rates for Quadrant B Data is divided into 100 sec bins |
 |
 |
| Module-wise count rates for Quadrant C Data is divided into 100 sec bins |
 |
 |
| Module-wise count rates for Quadrant D Data is divided into 100 sec bins |
 |
 |
| Parameter | Plot |
|---|---|
| CZT HV Monitor | 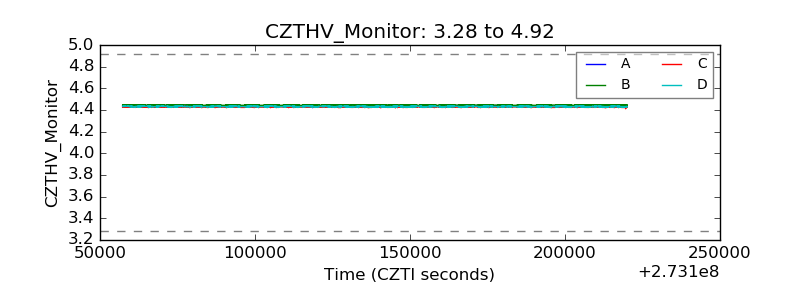 |
| D_VDD |  |
| Temperature 1 |  |
| Veto HV Monitor |  |
| Veto LLD |  |
| Alpha Counter |  |
| _CPM_Rate |  |
| CZT Counter |  |
| +2.5 Volts monitor |  |
| +5 Volts monitor | 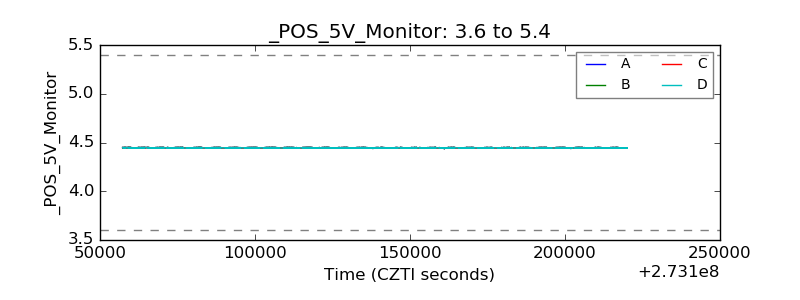 |
| _ROLL_ROT |  |
| _Roll_DEC |  |
| _Roll_RA |  |
| Veto Counter |  |