| Param | Original file | Final file |
|---|---|---|
| Filename | modeM0/AS1T02_088T01_9000002332cztM0_level2_bc.evt | modeM0/AS1T02_088T01_9000002332cztM0_level2_quad_clean.evt |
| Size (bytes) | 2,539,673,280 | 996,053,760 |
| Size | 2.4 GB | 949.9 MB |
| Events in quadrant A | 17,418,100 | 6,211,343 |
| Events in quadrant B | 19,094,278 | 6,324,939 |
| Events in quadrant C | 16,748,444 | 6,079,661 |
| Events in quadrant D | 18,070,376 | 5,942,062 |
| Mode M0 | |||
|---|---|---|---|
| Quadrant | BADHDUFLAG | Total packets | Discarded packets |
| A | 0 | 172068 | 0 |
| B | 0 | 174976 | 0 |
| C | 0 | 170549 | 0 |
| D | 0 | 172141 | 0 |
| Mode M9 | |||
|---|---|---|---|
| Quadrant | BADHDUFLAG | Total packets | Discarded packets |
| A | 0 | 130 | 0 |
| B | 0 | 130 | 0 |
| C | 0 | 130 | 0 |
| D | 0 | 130 | 0 |
| Mode SS | |||
|---|---|---|---|
| Quadrant | BADHDUFLAG | Total packets | Discarded packets |
| A | 0 | 1670 | 0 |
| B | 0 | 1670 | 0 |
| C | 0 | 1670 | 0 |
| D | 0 | 1670 | 0 |
| Quadrant | Total seconds | Saturated seconds | Saturation percentage |
|---|---|---|---|
| A | 81854 | 1263 | 1.542991% |
| B | 81854 | 1297 | 1.584529% |
| C | 81854 | 1437 | 1.755565% |
| D | 81854 | 1006 | 1.229018% |
Noise dominated data is calculated using 1-second bins in cleaned event files. If a bin has >2000 counts, and if more than 50% of those come from <1% of pixels, then it is considered to be noise-dominated and hence unusable.
| Quadrant | # 1 sec bins | Bins with >0 counts | Bins with >2000 counts | High rate bins dominated by noise | Noise dominated (total time) | Noise dominated (detector-on time) | Marked lightcurve |
|---|---|---|---|---|---|---|---|
| A | 95080 | 81862 | 10 | 10 | 0.01% | 0.01% |  |
| B | 95080 | 81856 | 18 | 18 | 0.02% | 0.02% | 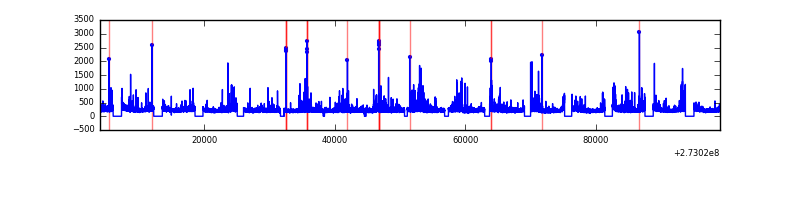 |
| C | 95080 | 81856 | 1 | 1 | 0.00% | 0.00% | 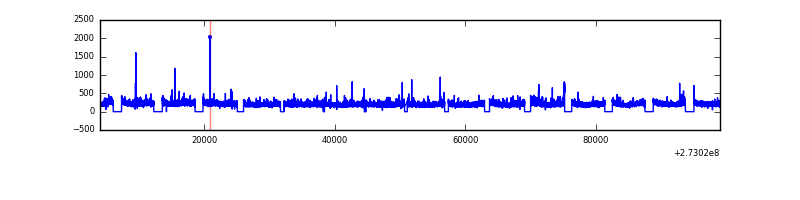 |
| D | 95080 | 81855 | 67 | 67 | 0.07% | 0.08% |  |
Top three noisy pixels from each quadrant. If the there are fewer than three noisy pixels in the level2.evt file, extra rows are filled as -1
| Pixel properties | Quadrant properties | ||||||
|---|---|---|---|---|---|---|---|
| Quadrant | DetID | PixID | Counts | Sigma | Mean | Median | Sigma |
| A | 15 | 239 | 399737 | 425.5 | 4284 | 4198 | 929.6 |
| A | 9 | 143 | 260291 | 275.49 | 4284 | 4198 | 929.6 |
| A | 3 | 80 | 122624 | 127.4 | 4284 | 4198 | 929.6 |
| B | 4 | 251 | 639479 | 786.6 | 4340 | 4232 | 807.6 |
| B | 3 | 209 | 414363 | 507.85 | 4340 | 4232 | 807.6 |
| B | 4 | 216 | 247596 | 301.35 | 4340 | 4232 | 807.6 |
| C | 3 | 233 | 568670 | 582.84 | 4145 | 4122 | 968.6 |
| C | 7 | 247 | 97111 | 96.0 | 4145 | 4122 | 968.6 |
| C | 10 | 187 | 66941 | 64.85 | 4145 | 4122 | 968.6 |
| D | 1 | 52 | 872023 | 813.5 | 4188 | 4059 | 1066.9 |
| D | 13 | 104 | 403432 | 374.31 | 4188 | 4059 | 1066.9 |
| D | 2 | 234 | 317887 | 294.14 | 4188 | 4059 | 1066.9 |
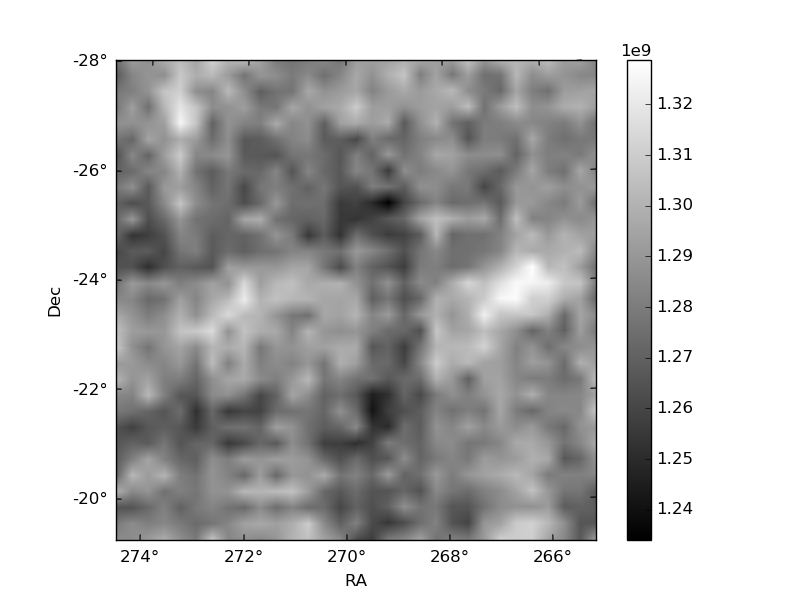
Histogram calculated using DETX and DETY for each event in the final _common_clean file
| Quadrant A | 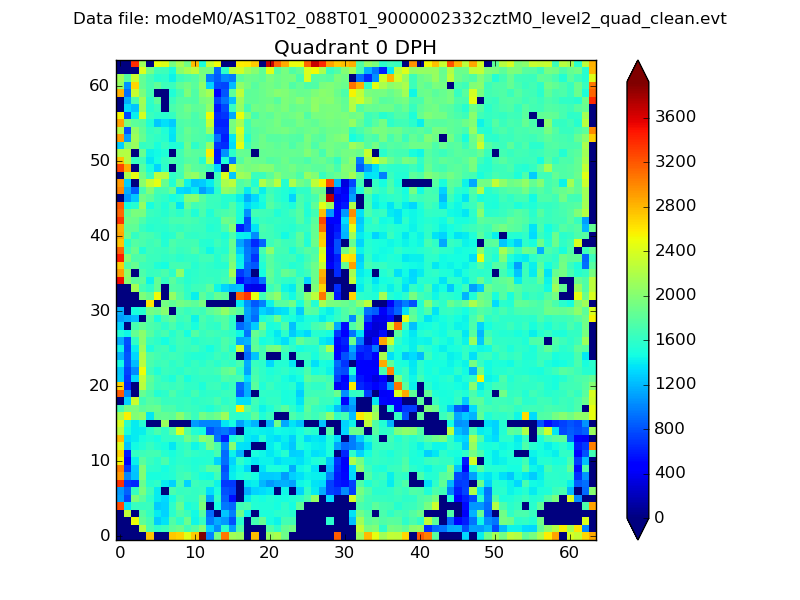 |
 |
Quadrant B |
|---|---|---|---|
| Quadrant D |  |
 |
Quadrant C |
| Plot type | Count rate plots | Images |
|---|---|---|
| Comparison with Poisson distribution Blue bars denote a histogram of data divided into 1 sec bins. Red curve is a Poisson curve with rate = median count rate of data. |
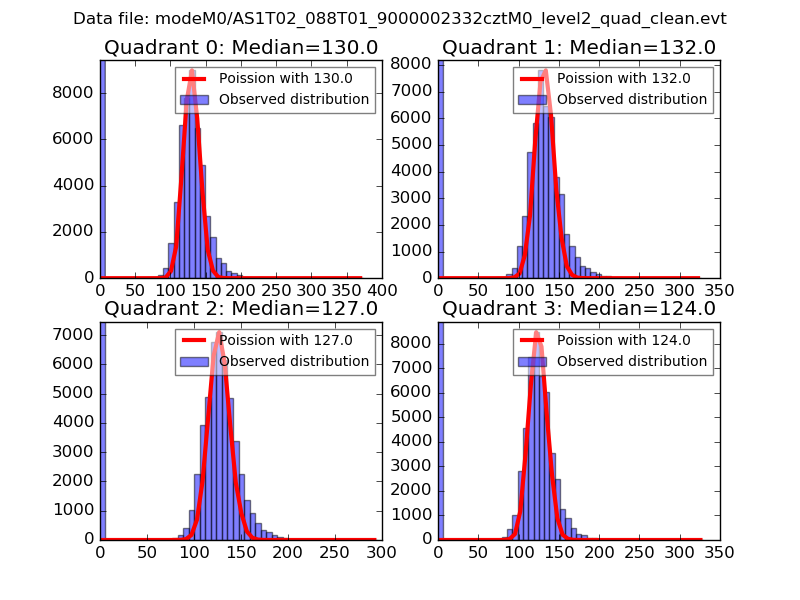 |
 |
| Quadrant-wise count rates Data is divided into 100 sec bins |
 |
|
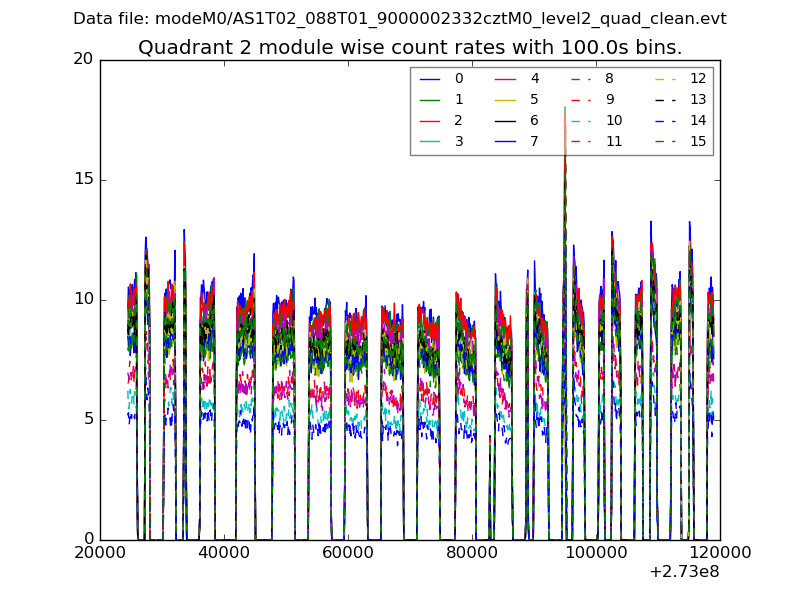
| Module-wise count rates for Quadrant A Data is divided into 100 sec bins |
 |
 |
| Module-wise count rates for Quadrant B Data is divided into 100 sec bins |
 |
 |
| Module-wise count rates for Quadrant C Data is divided into 100 sec bins |
 |
 |
| Module-wise count rates for Quadrant D Data is divided into 100 sec bins |
 |
 |
| Parameter | Plot |
|---|---|
| CZT HV Monitor |  |
| D_VDD |  |
| Temperature 1 |  |
| Veto HV Monitor | 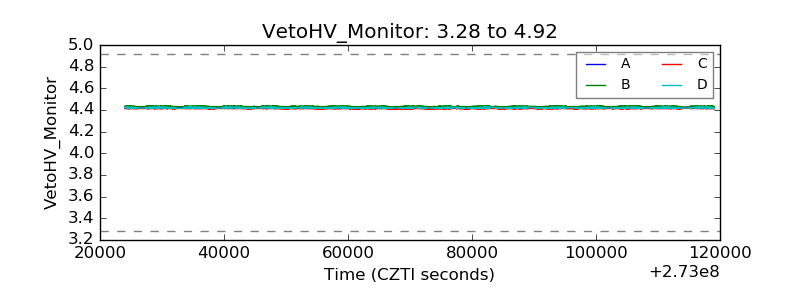 |
| Veto LLD |  |
| Alpha Counter |  |
| _CPM_Rate |  |
| CZT Counter |  |
| +2.5 Volts monitor |  |
| +5 Volts monitor |  |
| _ROLL_ROT |  |
| _Roll_DEC |  |
| _Roll_RA | 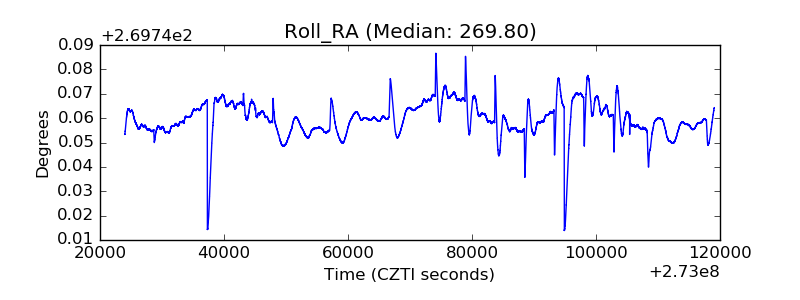 |
| Veto Counter |  |