| Param | Original file | Final file |
|---|---|---|
| Filename | modeM0/AS1T02_095T01_9000002330cztM0_level2_bc.evt | modeM0/AS1T02_095T01_9000002330cztM0_level2_quad_clean.evt |
| Size (bytes) | 2,291,538,240 | 636,920,640 |
| Size | 2.1 GB | 607.4 MB |
| Events in quadrant A | 26,602,036 | 3,831,679 |
| Events in quadrant B | 13,695,815 | 4,145,938 |
| Events in quadrant C | 9,792,180 | 4,066,803 |
| Events in quadrant D | 16,045,602 | 3,959,436 |
| Mode M0 | |||
|---|---|---|---|
| Quadrant | BADHDUFLAG | Total packets | Discarded packets |
| A | 0 | 161295 | 0 |
| B | 0 | 112247 | 0 |
| C | 0 | 100781 | 0 |
| D | 0 | 119974 | 0 |
| Mode SS | |||
|---|---|---|---|
| Quadrant | BADHDUFLAG | Total packets | Discarded packets |
| A | 0 | 972 | 0 |
| B | 0 | 972 | 0 |
| C | 0 | 972 | 0 |
| D | 0 | 972 | 0 |
| Mode M9 | |||
|---|---|---|---|
| Quadrant | BADHDUFLAG | Total packets | Discarded packets |
| A | 0 | 55 | 0 |
| B | 0 | 55 | 0 |
| C | 0 | 55 | 0 |
| D | 0 | 55 | 0 |
| Quadrant | Total seconds | Saturated seconds | Saturation percentage |
|---|---|---|---|
| A | 47877 | 9039 | 18.879629% |
| B | 47877 | 1457 | 3.043215% |
| C | 47877 | 1118 | 2.335150% |
| D | 47877 | 2260 | 4.720429% |
Noise dominated data is calculated using 1-second bins in cleaned event files. If a bin has >2000 counts, and if more than 50% of those come from <1% of pixels, then it is considered to be noise-dominated and hence unusable.
| Quadrant | # 1 sec bins | Bins with >0 counts | Bins with >2000 counts | High rate bins dominated by noise | Noise dominated (total time) | Noise dominated (detector-on time) | Marked lightcurve |
|---|---|---|---|---|---|---|---|
| A | 53298 | 47879 | 2425 | 2425 | 4.55% | 5.06% |  |
| B | 53298 | 47882 | 47 | 47 | 0.09% | 0.10% | 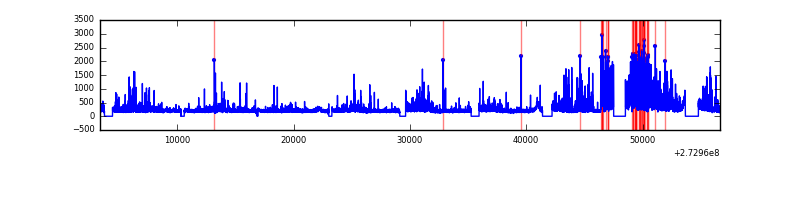 |
| C | 53298 | 47882 | 6 | 6 | 0.01% | 0.01% |  |
| D | 53298 | 47879 | 512 | 512 | 0.96% | 1.07% | 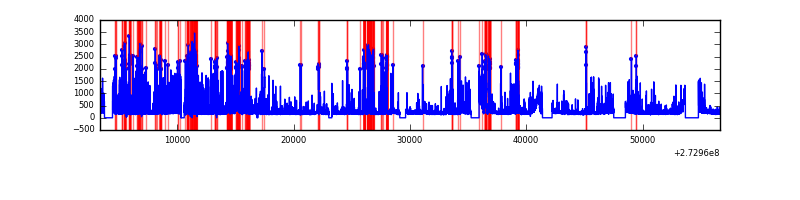 |
Top three noisy pixels from each quadrant. If the there are fewer than three noisy pixels in the level2.evt file, extra rows are filled as -1
| Pixel properties | Quadrant properties | ||||||
|---|---|---|---|---|---|---|---|
| Quadrant | DetID | PixID | Counts | Sigma | Mean | Median | Sigma |
| A | 15 | 239 | 17718219 | 34955.46 | 2263 | 2217 | 506.8 |
| A | 9 | 143 | 151138 | 293.84 | 2263 | 2217 | 506.8 |
| A | 13 | 210 | 18411 | 31.95 | 2263 | 2217 | 506.8 |
| B | 4 | 251 | 3469230 | 7371.25 | 2431 | 2363 | 470.3 |
| B | 4 | 216 | 132742 | 277.21 | 2431 | 2363 | 470.3 |
| B | 4 | 173 | 114730 | 238.91 | 2431 | 2363 | 470.3 |
| C | 3 | 233 | 288524 | 502.56 | 2371 | 2349 | 569.4 |
| C | 15 | 127 | 237706 | 413.32 | 2371 | 2349 | 569.4 |
| C | 9 | 54 | 88050 | 150.5 | 2371 | 2349 | 569.4 |
| D | 1 | 52 | 6265926 | 10648.36 | 2433 | 2341 | 588.2 |
| D | 2 | 234 | 200928 | 337.61 | 2433 | 2341 | 588.2 |
| D | 10 | 70 | 77367 | 127.55 | 2433 | 2341 | 588.2 |
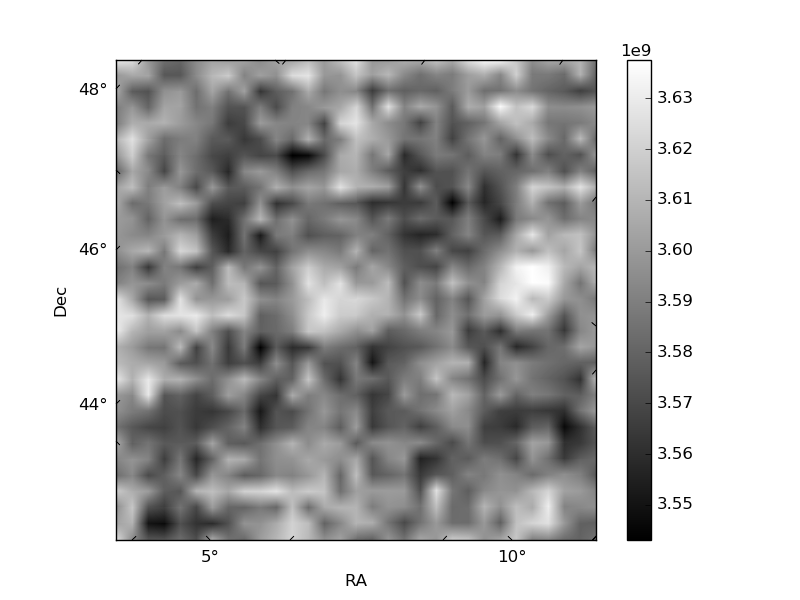
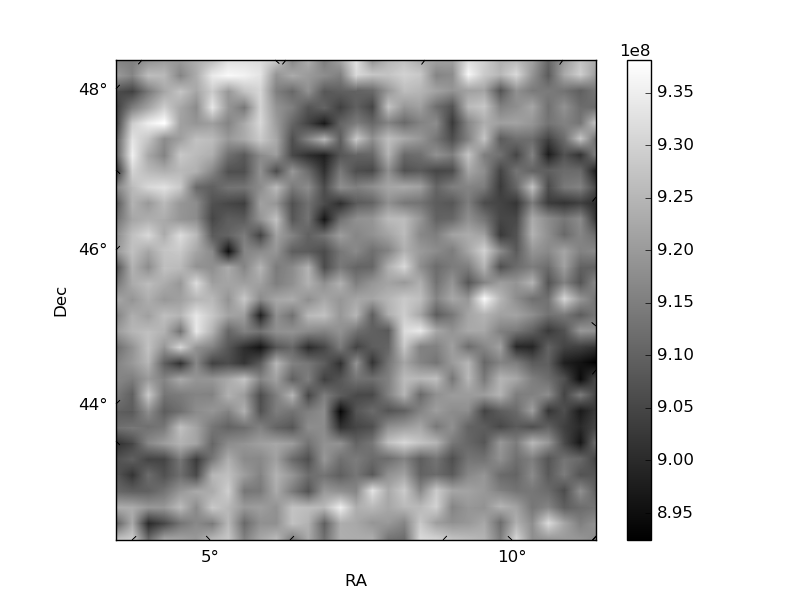
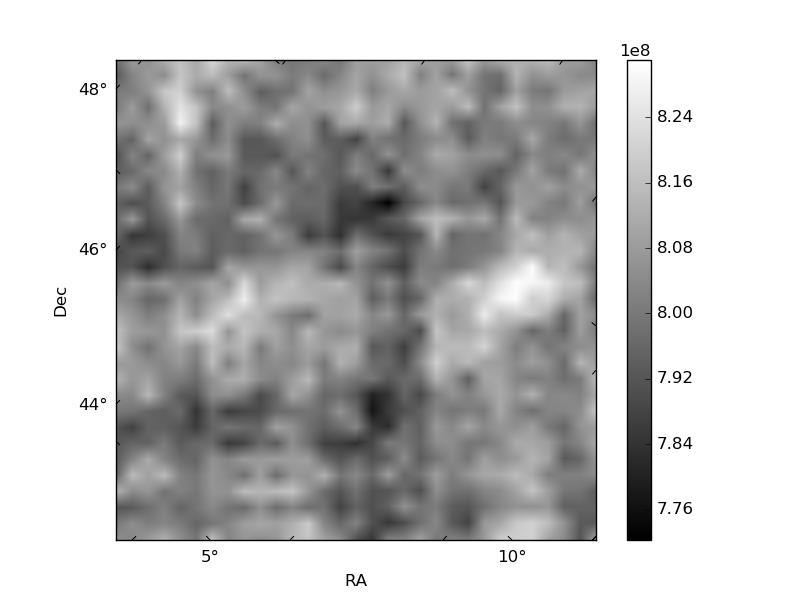
Histogram calculated using DETX and DETY for each event in the final _common_clean file
| Quadrant A |  |
 |
Quadrant B |
|---|---|---|---|
| Quadrant D |  |
 |
Quadrant C |
| Plot type | Count rate plots | Images |
|---|---|---|
| Comparison with Poisson distribution Blue bars denote a histogram of data divided into 1 sec bins. Red curve is a Poisson curve with rate = median count rate of data. |
 |
 |
| Quadrant-wise count rates Data is divided into 100 sec bins |
 |
|
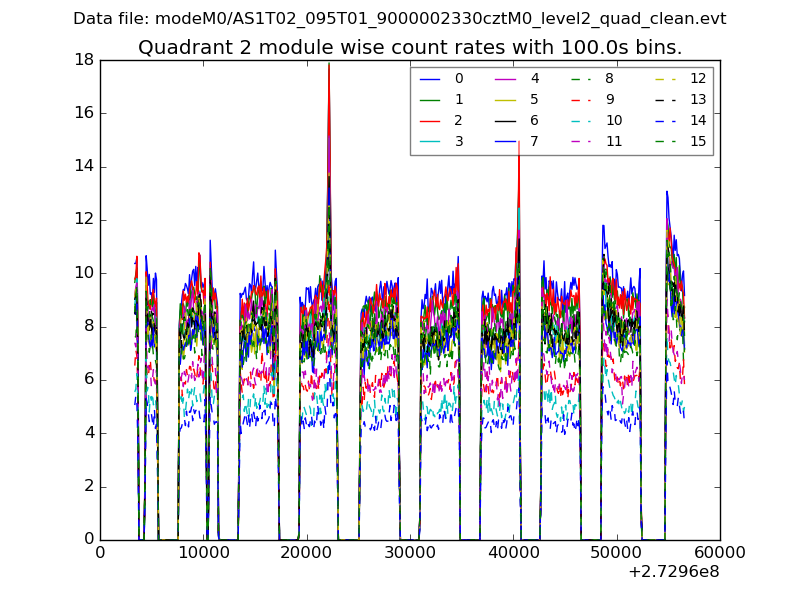
| Module-wise count rates for Quadrant A Data is divided into 100 sec bins |
 |
 |
| Module-wise count rates for Quadrant B Data is divided into 100 sec bins |
 |
 |
| Module-wise count rates for Quadrant C Data is divided into 100 sec bins |
 |
 |
| Module-wise count rates for Quadrant D Data is divided into 100 sec bins |
 |
 |
| Parameter | Plot |
|---|---|
| CZT HV Monitor | 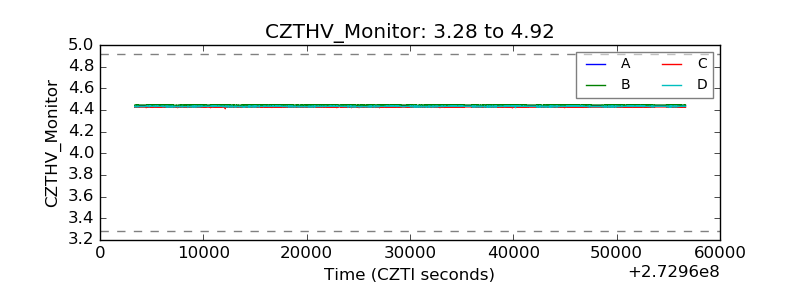 |
| D_VDD | 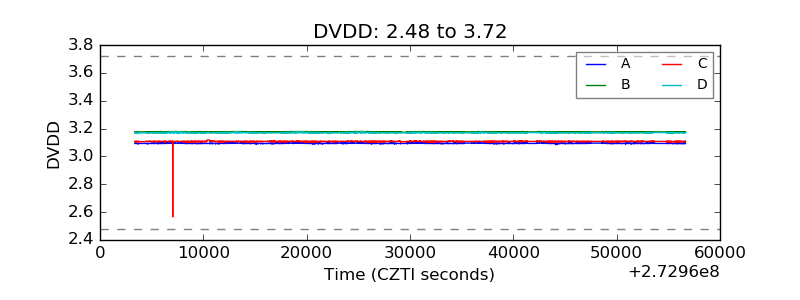 |
| Temperature 1 | 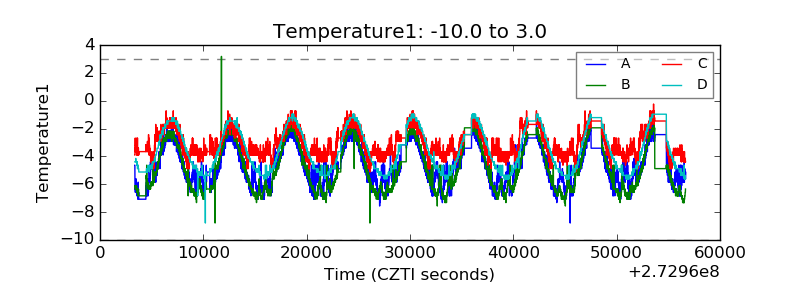 |
| Veto HV Monitor |  |
| Veto LLD |  |
| Alpha Counter |  |
| _CPM_Rate |  |
| CZT Counter |  |
| +2.5 Volts monitor |  |
| +5 Volts monitor |  |
| _ROLL_ROT | 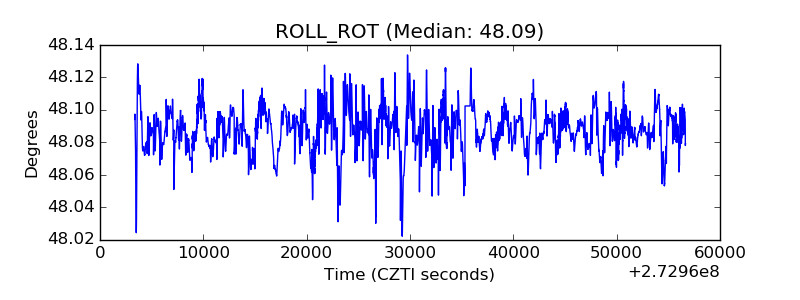 |
| _Roll_DEC |  |
| _Roll_RA |  |
| Veto Counter |  |