| Param | Original file | Final file |
|---|---|---|
| Filename | modeM0/AS1C03_015T04_9000002328cztM0_level2_bc.evt | modeM0/AS1C03_015T04_9000002328cztM0_level2_quad_clean.evt |
| Size (bytes) | 604,160,640 | 333,112,320 |
| Size | 576.2 MB | 317.7 MB |
| Events in quadrant A | 3,675,291 | 2,252,804 |
| Events in quadrant B | 3,857,064 | 2,315,110 |
| Events in quadrant C | 4,259,283 | 2,194,322 |
| Events in quadrant D | 5,320,809 | 2,136,420 |
| Mode M9 | |||
|---|---|---|---|
| Quadrant | BADHDUFLAG | Total packets | Discarded packets |
| A | 0 | 37 | 0 |
| B | 0 | 37 | 0 |
| C | 0 | 37 | 0 |
| D | 0 | 37 | 0 |
| Mode SS | |||
|---|---|---|---|
| Quadrant | BADHDUFLAG | Total packets | Discarded packets |
| A | 0 | 352 | 0 |
| B | 0 | 352 | 0 |
| C | 0 | 352 | 0 |
| D | 0 | 352 | 0 |
| Mode M0 | |||
|---|---|---|---|
| Quadrant | BADHDUFLAG | Total packets | Discarded packets |
| A | 0 | 35635 | 0 |
| B | 0 | 36040 | 0 |
| C | 0 | 37727 | 0 |
| D | 0 | 41046 | 0 |
| Quadrant | Total seconds | Saturated seconds | Saturation percentage |
|---|---|---|---|
| A | 17290 | 51 | 0.294968% |
| B | 17290 | 99 | 0.572585% |
| C | 17290 | 161 | 0.931174% |
| D | 17290 | 417 | 2.411799% |
Noise dominated data is calculated using 1-second bins in cleaned event files. If a bin has >2000 counts, and if more than 50% of those come from <1% of pixels, then it is considered to be noise-dominated and hence unusable.
| Quadrant | # 1 sec bins | Bins with >0 counts | Bins with >2000 counts | High rate bins dominated by noise | Noise dominated (total time) | Noise dominated (detector-on time) | Marked lightcurve |
|---|---|---|---|---|---|---|---|
| A | 21011 | 17291 | 1 | 1 | 0.00% | 0.01% |  |
| B | 21011 | 17292 | 0 | 0 | 0.00% | 0.00% |  |
| C | 21011 | 17291 | 0 | 0 | 0.00% | 0.00% |  |
| D | 21011 | 17291 | 70 | 70 | 0.33% | 0.40% |  |
Top three noisy pixels from each quadrant. If the there are fewer than three noisy pixels in the level2.evt file, extra rows are filled as -1
| Pixel properties | Quadrant properties | ||||||
|---|---|---|---|---|---|---|---|
| Quadrant | DetID | PixID | Counts | Sigma | Mean | Median | Sigma |
| A | 15 | 239 | 57144 | 285.63 | 905 | 889 | 196.9 |
| A | 15 | 69 | 56144 | 280.55 | 905 | 889 | 196.9 |
| A | 13 | 248 | 45068 | 224.32 | 905 | 889 | 196.9 |
| B | 4 | 216 | 71023 | 399.17 | 924 | 903 | 175.7 |
| B | 3 | 209 | 53865 | 301.5 | 924 | 903 | 175.7 |
| B | 5 | 65 | 43470 | 242.32 | 924 | 903 | 175.7 |
| C | 3 | 233 | 854866 | 4107.06 | 872 | 869 | 207.9 |
| C | 7 | 247 | 19801 | 91.05 | 872 | 869 | 207.9 |
| C | 10 | 22 | 10518 | 46.4 | 872 | 869 | 207.9 |
| D | 1 | 52 | 1558445 | 6901.54 | 874 | 850 | 225.7 |
| D | 12 | 6 | 108241 | 475.84 | 874 | 850 | 225.7 |
| D | 2 | 234 | 74373 | 325.77 | 874 | 850 | 225.7 |
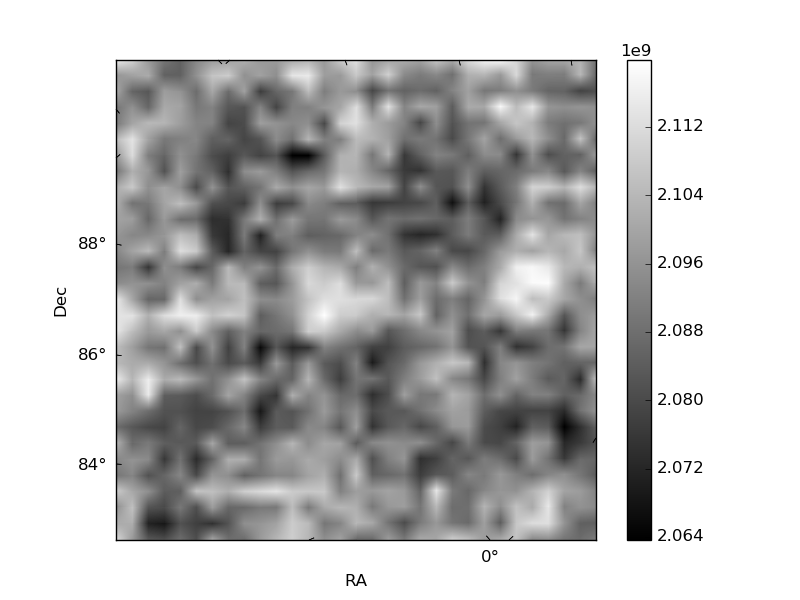
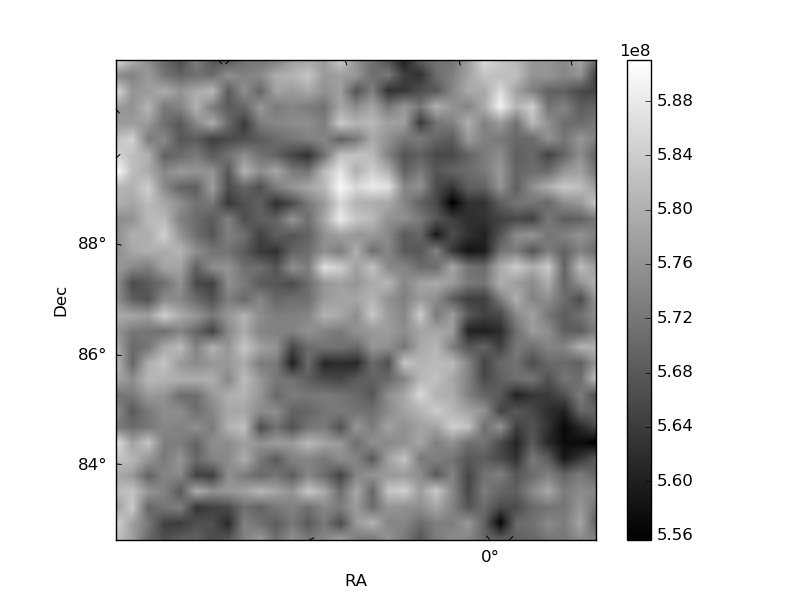
Histogram calculated using DETX and DETY for each event in the final _common_clean file
| Quadrant A |  |
 |
Quadrant B |
|---|---|---|---|
| Quadrant D |  |
 |
Quadrant C |
| Plot type | Count rate plots | Images |
|---|---|---|
| Comparison with Poisson distribution Blue bars denote a histogram of data divided into 1 sec bins. Red curve is a Poisson curve with rate = median count rate of data. |
 |
 |
| Quadrant-wise count rates Data is divided into 100 sec bins |
 |
|
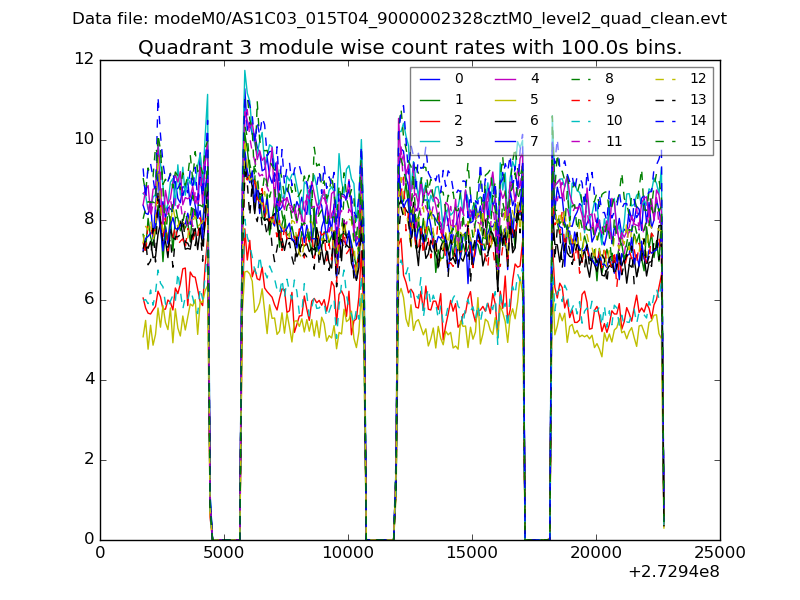
| Module-wise count rates for Quadrant A Data is divided into 100 sec bins |
 |
 |
| Module-wise count rates for Quadrant B Data is divided into 100 sec bins |
 |
 |
| Module-wise count rates for Quadrant C Data is divided into 100 sec bins |
 |
 |
| Module-wise count rates for Quadrant D Data is divided into 100 sec bins |
 |
 |
| Parameter | Plot |
|---|---|
| CZT HV Monitor |  |
| D_VDD |  |
| Temperature 1 |  |
| Veto HV Monitor |  |
| Veto LLD |  |
| Alpha Counter | 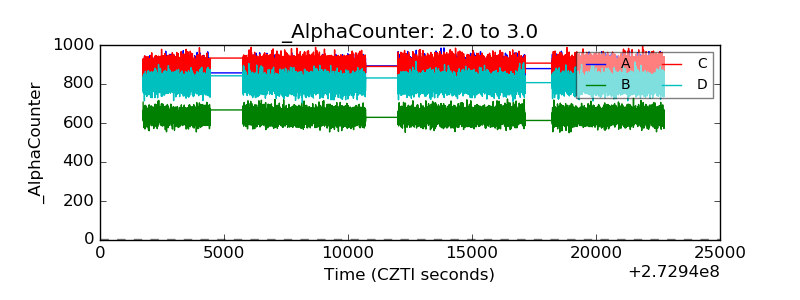 |
| _CPM_Rate |  |
| CZT Counter |  |
| +2.5 Volts monitor |  |
| +5 Volts monitor |  |
| _ROLL_ROT |  |
| _Roll_DEC |  |
| _Roll_RA |  |
| Veto Counter | 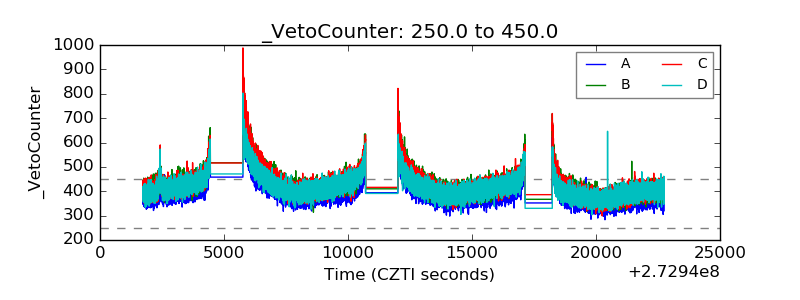 |