| Param | Original file | Final file |
|---|---|---|
| Filename | modeM0/AS1G08_030T01_9000002326cztM0_level2_bc.evt | modeM0/AS1G08_030T01_9000002326cztM0_level2_quad_clean.evt |
| Size (bytes) | 830,721,600 | 301,046,400 |
| Size | 792.2 MB | 287.1 MB |
| Events in quadrant A | 5,007,609 | 1,905,176 |
| Events in quadrant B | 5,263,582 | 1,932,819 |
| Events in quadrant C | 5,779,862 | 1,847,113 |
| Events in quadrant D | 7,455,802 | 1,771,288 |
| Mode M0 | |||
|---|---|---|---|
| Quadrant | BADHDUFLAG | Total packets | Discarded packets |
| A | 0 | 49897 | 0 |
| B | 0 | 50687 | 0 |
| C | 0 | 52745 | 0 |
| D | 0 | 57948 | 0 |
| Mode M9 | |||
|---|---|---|---|
| Quadrant | BADHDUFLAG | Total packets | Discarded packets |
| A | 0 | 52 | 0 |
| B | 0 | 52 | 0 |
| C | 0 | 52 | 0 |
| D | 0 | 52 | 0 |
| Mode SS | |||
|---|---|---|---|
| Quadrant | BADHDUFLAG | Total packets | Discarded packets |
| A | 0 | 494 | 0 |
| B | 0 | 494 | 0 |
| C | 0 | 494 | 0 |
| D | 0 | 494 | 0 |
| Quadrant | Total seconds | Saturated seconds | Saturation percentage |
|---|---|---|---|
| A | 24149 | 132 | 0.546606% |
| B | 24149 | 179 | 0.741232% |
| C | 24149 | 257 | 1.064226% |
| D | 24149 | 602 | 2.492857% |
Noise dominated data is calculated using 1-second bins in cleaned event files. If a bin has >2000 counts, and if more than 50% of those come from <1% of pixels, then it is considered to be noise-dominated and hence unusable.
| Quadrant | # 1 sec bins | Bins with >0 counts | Bins with >2000 counts | High rate bins dominated by noise | Noise dominated (total time) | Noise dominated (detector-on time) | Marked lightcurve |
|---|---|---|---|---|---|---|---|
| A | 29381 | 24150 | 2 | 2 | 0.01% | 0.01% | 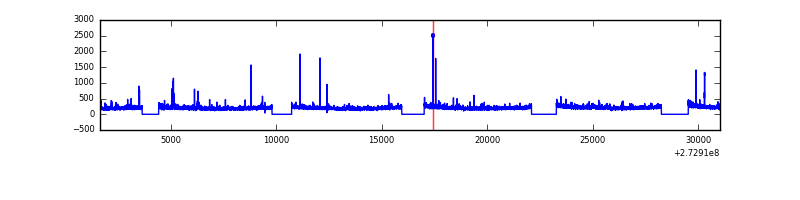 |
| B | 29381 | 24150 | 4 | 4 | 0.01% | 0.02% |  |
| C | 29381 | 24150 | 0 | 0 | 0.00% | 0.00% |  |
| D | 29381 | 24152 | 207 | 207 | 0.70% | 0.86% |  |
Top three noisy pixels from each quadrant. If the there are fewer than three noisy pixels in the level2.evt file, extra rows are filled as -1
| Pixel properties | Quadrant properties | ||||||
|---|---|---|---|---|---|---|---|
| Quadrant | DetID | PixID | Counts | Sigma | Mean | Median | Sigma |
| A | 15 | 239 | 143560 | 516.0 | 1255 | 1231 | 275.8 |
| A | 9 | 143 | 21925 | 75.02 | 1255 | 1231 | 275.8 |
| A | 13 | 248 | 14866 | 49.43 | 1255 | 1231 | 275.8 |
| B | 3 | 209 | 63206 | 254.51 | 1273 | 1240 | 243.5 |
| B | 5 | 236 | 54632 | 219.3 | 1273 | 1240 | 243.5 |
| B | 4 | 216 | 51923 | 208.17 | 1273 | 1240 | 243.5 |
| C | 3 | 233 | 1016024 | 3525.89 | 1220 | 1216 | 287.8 |
| C | 10 | 22 | 21755 | 71.36 | 1220 | 1216 | 287.8 |
| C | 9 | 54 | 17733 | 57.39 | 1220 | 1216 | 287.8 |
| D | 1 | 52 | 2166394 | 7020.94 | 1214 | 1181 | 308.4 |
| D | 12 | 110 | 397784 | 1286.03 | 1214 | 1181 | 308.4 |
| D | 2 | 234 | 96172 | 308.02 | 1214 | 1181 | 308.4 |
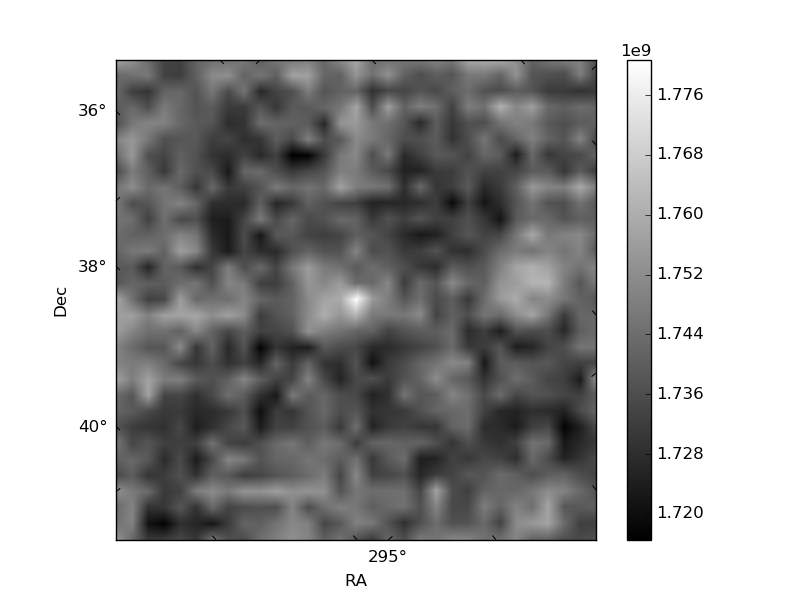
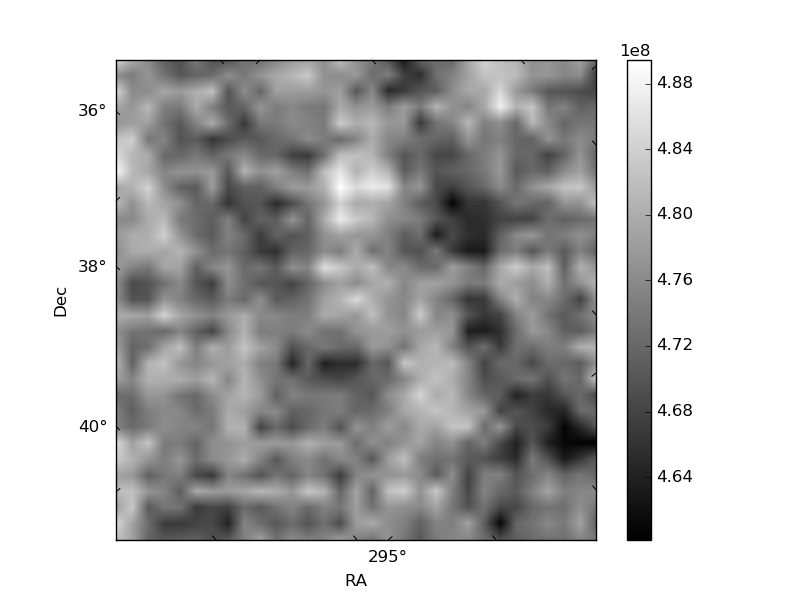
Histogram calculated using DETX and DETY for each event in the final _common_clean file
| Quadrant A |  |
 |
Quadrant B |
|---|---|---|---|
| Quadrant D |  |
 |
Quadrant C |
| Plot type | Count rate plots | Images |
|---|---|---|
| Comparison with Poisson distribution Blue bars denote a histogram of data divided into 1 sec bins. Red curve is a Poisson curve with rate = median count rate of data. |
 |
 |
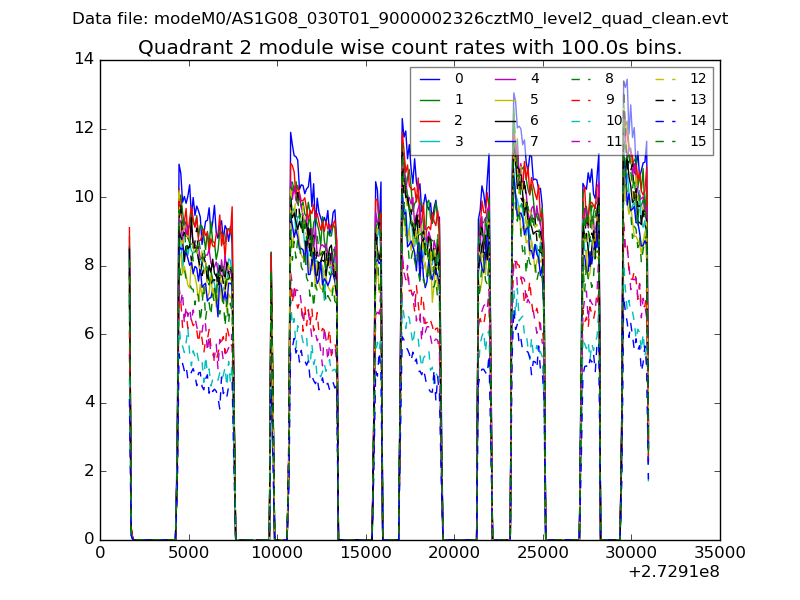
| Quadrant-wise count rates Data is divided into 100 sec bins |
 |
|
| Module-wise count rates for Quadrant A Data is divided into 100 sec bins |
 |
 |
| Module-wise count rates for Quadrant B Data is divided into 100 sec bins |
 |
 |
| Module-wise count rates for Quadrant C Data is divided into 100 sec bins |
 |
 |
| Module-wise count rates for Quadrant D Data is divided into 100 sec bins |
 |
 |
| Parameter | Plot |
|---|---|
| CZT HV Monitor | 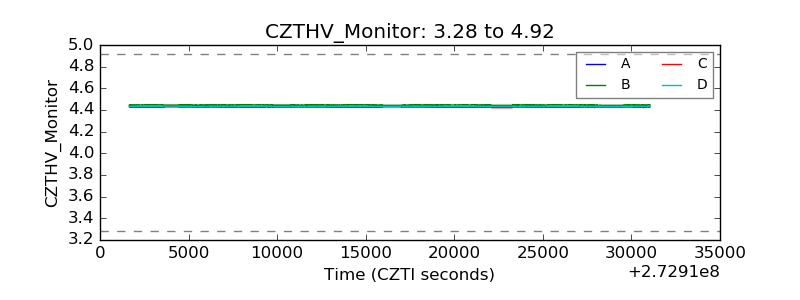 |
| D_VDD |  |
| Temperature 1 |  |
| Veto HV Monitor |  |
| Veto LLD |  |
| Alpha Counter |  |
| _CPM_Rate | 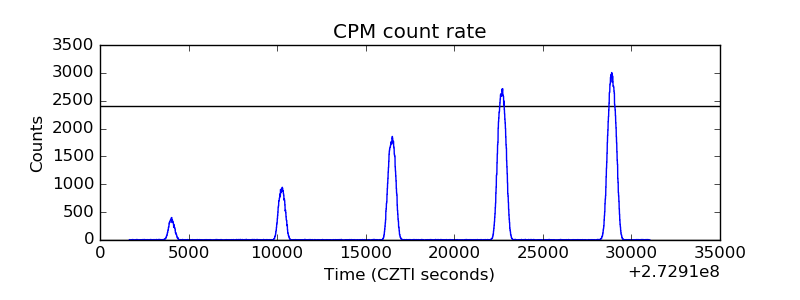 |
| CZT Counter |  |
| +2.5 Volts monitor |  |
| +5 Volts monitor | 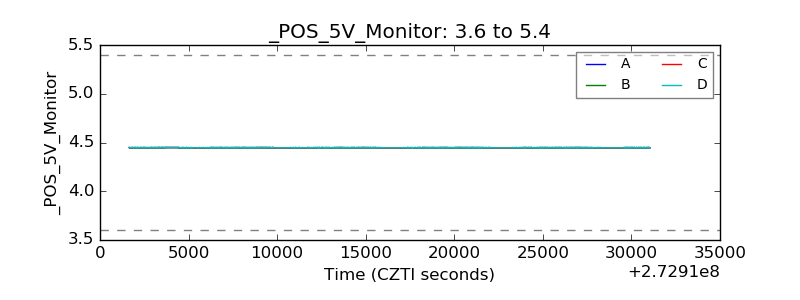 |
| _ROLL_ROT | 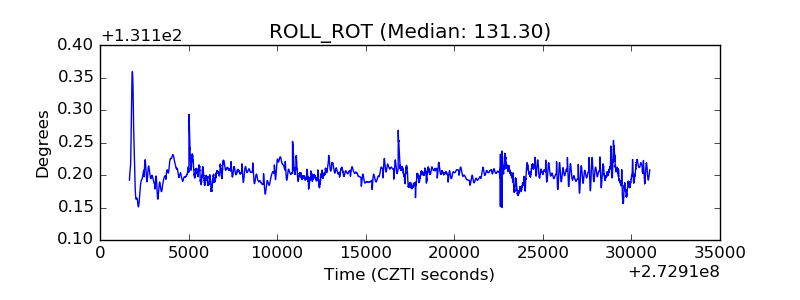 |
| _Roll_DEC |  |
| _Roll_RA |  |
| Veto Counter |  |