| Param | Original file | Final file |
|---|---|---|
| Filename | modeM0/AS1A04_198T01_9000002322cztM0_level2_bc.evt | modeM0/AS1A04_198T01_9000002322cztM0_level2_quad_clean.evt |
| Size (bytes) | 3,571,750,080 | 1,417,985,280 |
| Size | 3.3 GB | 1.3 GB |
| Events in quadrant A | 23,581,094 | 8,969,722 |
| Events in quadrant B | 23,057,774 | 9,190,677 |
| Events in quadrant C | 24,811,206 | 8,934,229 |
| Events in quadrant D | 29,652,746 | 8,747,130 |
| Mode M9 | |||
|---|---|---|---|
| Quadrant | BADHDUFLAG | Total packets | Discarded packets |
| A | 0 | 182 | 0 |
| B | 0 | 182 | 0 |
| C | 0 | 182 | 0 |
| D | 0 | 182 | 0 |
| Mode M0 | |||
|---|---|---|---|
| Quadrant | BADHDUFLAG | Total packets | Discarded packets |
| A | 0 | 224550 | 0 |
| B | 0 | 219391 | 0 |
| C | 0 | 228844 | 0 |
| D | 0 | 241911 | 0 |
| Mode SS | |||
|---|---|---|---|
| Quadrant | BADHDUFLAG | Total packets | Discarded packets |
| A | 0 | 2116 | 0 |
| B | 0 | 2116 | 0 |
| C | 0 | 2116 | 0 |
| D | 0 | 2116 | 0 |
| Quadrant | Total seconds | Saturated seconds | Saturation percentage |
|---|---|---|---|
| A | 103723 | 2561 | 2.469076% |
| B | 103723 | 1648 | 1.588847% |
| C | 103723 | 1973 | 1.902182% |
| D | 103723 | 2759 | 2.659969% |
Noise dominated data is calculated using 1-second bins in cleaned event files. If a bin has >2000 counts, and if more than 50% of those come from <1% of pixels, then it is considered to be noise-dominated and hence unusable.
| Quadrant | # 1 sec bins | Bins with >0 counts | Bins with >2000 counts | High rate bins dominated by noise | Noise dominated (total time) | Noise dominated (detector-on time) | Marked lightcurve |
|---|---|---|---|---|---|---|---|
| A | 121969 | 103730 | 81 | 81 | 0.07% | 0.08% |  |
| B | 121969 | 103726 | 24 | 24 | 0.02% | 0.02% |  |
| C | 121969 | 103726 | 7 | 7 | 0.01% | 0.01% |  |
| D | 121969 | 103726 | 341 | 341 | 0.28% | 0.33% |  |
Top three noisy pixels from each quadrant. If the there are fewer than three noisy pixels in the level2.evt file, extra rows are filled as -1
| Pixel properties | Quadrant properties | ||||||
|---|---|---|---|---|---|---|---|
| Quadrant | DetID | PixID | Counts | Sigma | Mean | Median | Sigma |
| A | 13 | 248 | 2415149 | 2117.48 | 5291 | 5191 | 1138.1 |
| A | 9 | 143 | 433757 | 376.55 | 5291 | 5191 | 1138.1 |
| A | 13 | 210 | 204764 | 175.35 | 5291 | 5191 | 1138.1 |
| B | 5 | 236 | 447556 | 439.38 | 5403 | 5270 | 1006.6 |
| B | 4 | 173 | 435452 | 427.35 | 5403 | 5270 | 1006.6 |
| B | 4 | 216 | 337583 | 330.13 | 5403 | 5270 | 1006.6 |
| C | 3 | 233 | 3709863 | 2977.3 | 5275 | 5244 | 1244.3 |
| C | 15 | 127 | 340668 | 269.57 | 5275 | 5244 | 1244.3 |
| C | 9 | 54 | 264891 | 208.67 | 5275 | 5244 | 1244.3 |
| D | 1 | 52 | 4974550 | 3729.7 | 5290 | 5150 | 1332.4 |
| D | 12 | 144 | 1932340 | 1446.42 | 5290 | 5150 | 1332.4 |
| D | 12 | 110 | 707222 | 526.93 | 5290 | 5150 | 1332.4 |
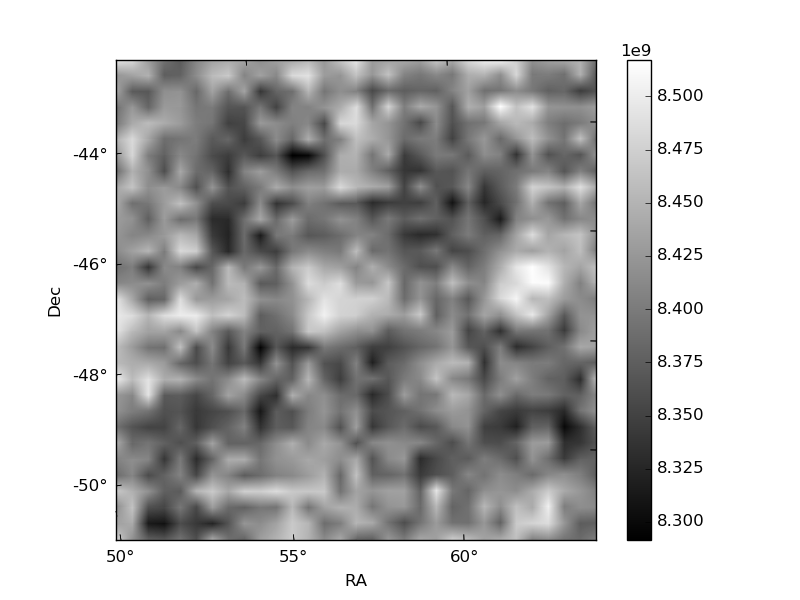
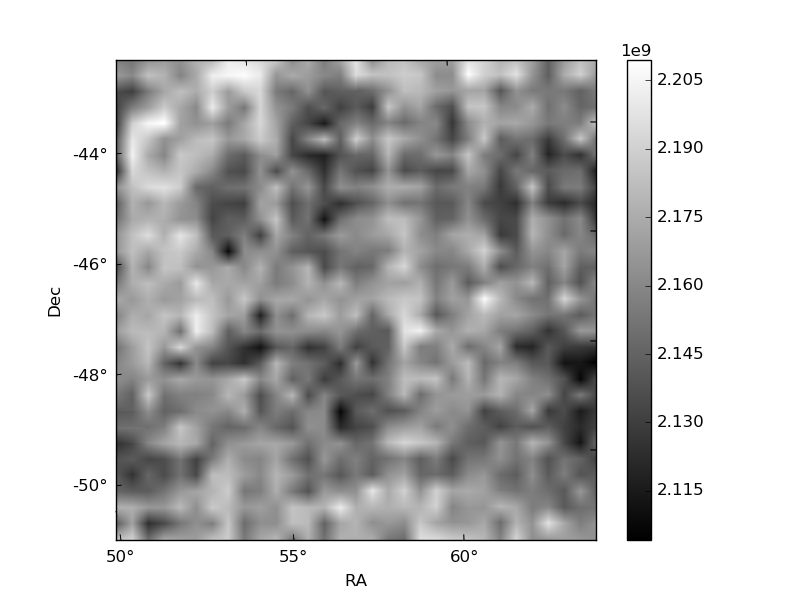
Histogram calculated using DETX and DETY for each event in the final _common_clean file
| Quadrant A |  |
 |
Quadrant B |
|---|---|---|---|
| Quadrant D |  |
 |
Quadrant C |
| Plot type | Count rate plots | Images |
|---|---|---|
| Comparison with Poisson distribution Blue bars denote a histogram of data divided into 1 sec bins. Red curve is a Poisson curve with rate = median count rate of data. |
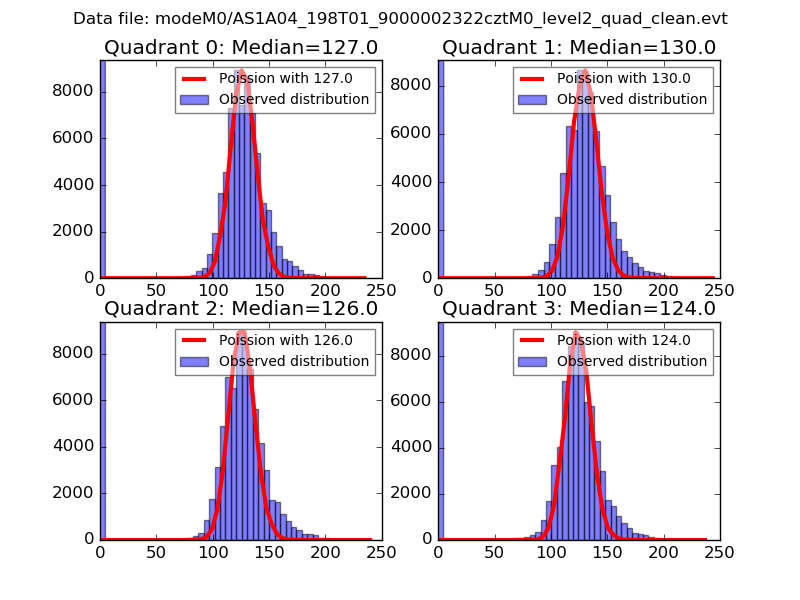 |
 |
| Quadrant-wise count rates Data is divided into 100 sec bins |
 |
|
| Module-wise count rates for Quadrant A Data is divided into 100 sec bins |
 |
 |
| Module-wise count rates for Quadrant B Data is divided into 100 sec bins |
 |
 |
| Module-wise count rates for Quadrant C Data is divided into 100 sec bins |
 |
 |
| Module-wise count rates for Quadrant D Data is divided into 100 sec bins |
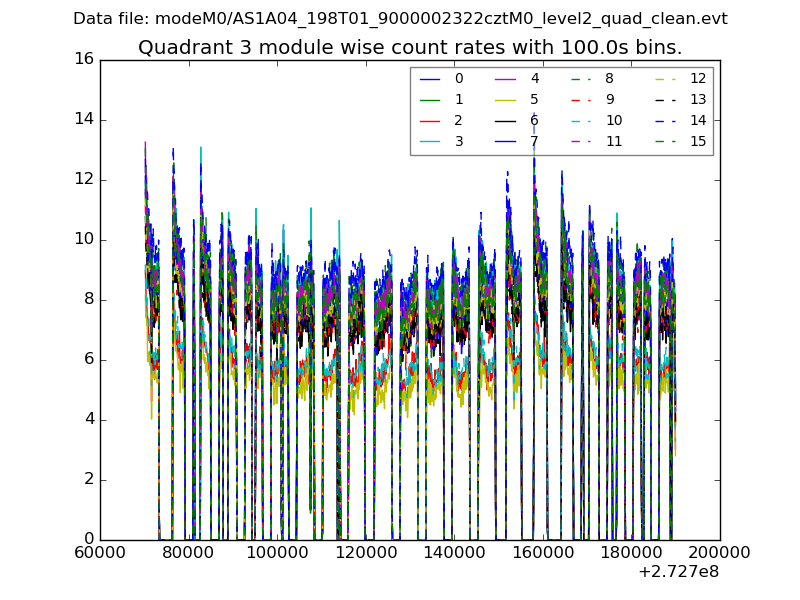 |
 |
| Parameter | Plot |
|---|---|
| CZT HV Monitor |  |
| D_VDD |  |
| Temperature 1 |  |
| Veto HV Monitor |  |
| Veto LLD |  |
| Alpha Counter |  |
| _CPM_Rate |  |
| CZT Counter |  |
| +2.5 Volts monitor |  |
| +5 Volts monitor |  |
| _ROLL_ROT |  |
| _Roll_DEC |  |
| _Roll_RA | 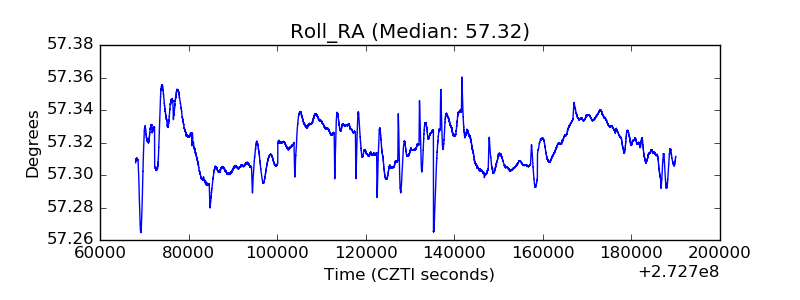 |
| Veto Counter |  |