| Param | Original file | Final file |
|---|---|---|
| Filename | modeM0/AS1T02_088T01_9000002320cztM0_level2_bc.evt | modeM0/AS1T02_088T01_9000002320cztM0_level2_quad_clean.evt |
| Size (bytes) | 2,547,552,960 | 892,601,280 |
| Size | 2.4 GB | 851.3 MB |
| Events in quadrant A | 15,325,706 | 5,599,030 |
| Events in quadrant B | 16,842,489 | 5,689,740 |
| Events in quadrant C | 15,372,783 | 5,473,475 |
| Events in quadrant D | 24,617,324 | 5,249,592 |
| Mode M0 | |||
|---|---|---|---|
| Quadrant | BADHDUFLAG | Total packets | Discarded packets |
| A | 0 | 151732 | 0 |
| B | 0 | 156604 | 0 |
| C | 0 | 153696 | 0 |
| D | 0 | 181601 | 0 |
| Mode SS | |||
|---|---|---|---|
| Quadrant | BADHDUFLAG | Total packets | Discarded packets |
| A | 0 | 1496 | 0 |
| B | 0 | 1496 | 0 |
| C | 0 | 1496 | 0 |
| D | 0 | 1496 | 0 |
| Mode M9 | |||
|---|---|---|---|
| Quadrant | BADHDUFLAG | Total packets | Discarded packets |
| A | 0 | 112 | 0 |
| B | 0 | 112 | 0 |
| C | 0 | 112 | 0 |
| D | 0 | 112 | 0 |
| Quadrant | Total seconds | Saturated seconds | Saturation percentage |
|---|---|---|---|
| A | 73258 | 876 | 1.195774% |
| B | 73258 | 1077 | 1.470147% |
| C | 73258 | 1277 | 1.743154% |
| D | 73258 | 2502 | 3.415327% |
Noise dominated data is calculated using 1-second bins in cleaned event files. If a bin has >2000 counts, and if more than 50% of those come from <1% of pixels, then it is considered to be noise-dominated and hence unusable.
| Quadrant | # 1 sec bins | Bins with >0 counts | Bins with >2000 counts | High rate bins dominated by noise | Noise dominated (total time) | Noise dominated (detector-on time) | Marked lightcurve |
|---|---|---|---|---|---|---|---|
| A | 84445 | 73264 | 17 | 17 | 0.02% | 0.02% |  |
| B | 84444 | 73263 | 9 | 9 | 0.01% | 0.01% |  |
| C | 84444 | 73264 | 5 | 5 | 0.01% | 0.01% |  |
| D | 84445 | 73262 | 607 | 607 | 0.72% | 0.83% |  |
Top three noisy pixels from each quadrant. If the there are fewer than three noisy pixels in the level2.evt file, extra rows are filled as -1
| Pixel properties | Quadrant properties | ||||||
|---|---|---|---|---|---|---|---|
| Quadrant | DetID | PixID | Counts | Sigma | Mean | Median | Sigma |
| A | 13 | 248 | 254783 | 300.54 | 3855 | 3784 | 835.2 |
| A | 13 | 210 | 123305 | 143.11 | 3855 | 3784 | 835.2 |
| A | 4 | 2 | 86259 | 98.75 | 3855 | 3784 | 835.2 |
| B | 5 | 236 | 443721 | 607.06 | 3909 | 3815 | 724.7 |
| B | 4 | 173 | 235923 | 320.3 | 3909 | 3815 | 724.7 |
| B | 4 | 216 | 226965 | 307.94 | 3909 | 3815 | 724.7 |
| C | 3 | 233 | 400419 | 459.0 | 3733 | 3719 | 864.3 |
| C | 7 | 221 | 227952 | 259.45 | 3733 | 3719 | 864.3 |
| C | 9 | 54 | 171457 | 194.08 | 3733 | 3719 | 864.3 |
| D | 1 | 52 | 7995348 | 9287.46 | 3742 | 3613 | 860.5 |
| D | 10 | 70 | 612092 | 707.13 | 3742 | 3613 | 860.5 |
| D | 12 | 110 | 589865 | 681.3 | 3742 | 3613 | 860.5 |
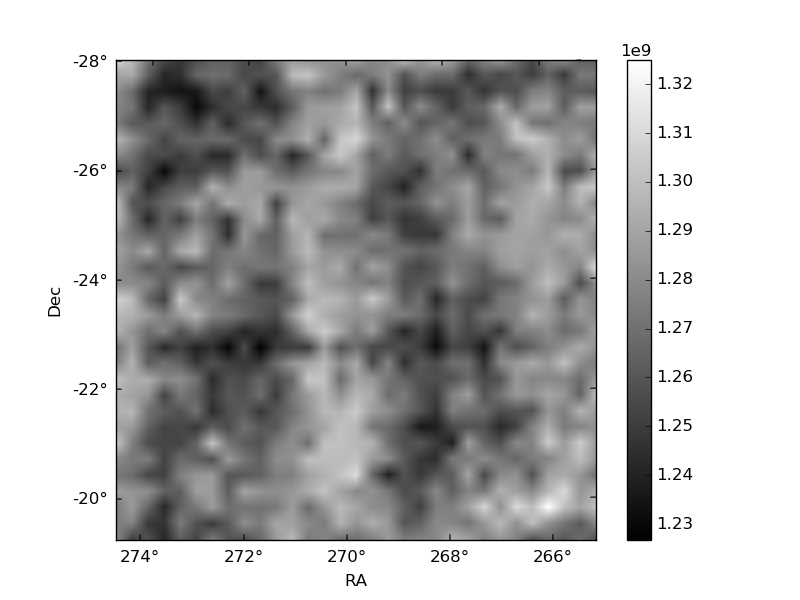
Histogram calculated using DETX and DETY for each event in the final _common_clean file
| Quadrant A |  |
 |
Quadrant B |
|---|---|---|---|
| Quadrant D |  |
 |
Quadrant C |
| Plot type | Count rate plots | Images |
|---|---|---|
| Comparison with Poisson distribution Blue bars denote a histogram of data divided into 1 sec bins. Red curve is a Poisson curve with rate = median count rate of data. |
 |
 |
| Quadrant-wise count rates Data is divided into 100 sec bins |
 |
|
| Module-wise count rates for Quadrant A Data is divided into 100 sec bins |
 |
 |
| Module-wise count rates for Quadrant B Data is divided into 100 sec bins |
 |
 |
| Module-wise count rates for Quadrant C Data is divided into 100 sec bins |
 |
 |
| Module-wise count rates for Quadrant D Data is divided into 100 sec bins |
 |
 |
| Parameter | Plot |
|---|---|
| CZT HV Monitor |  |
| D_VDD | 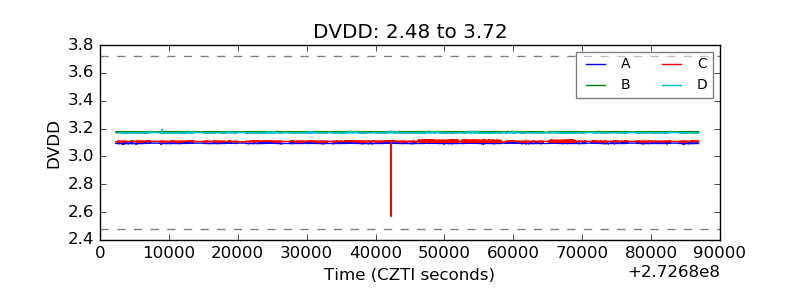 |
| Temperature 1 |  |
| Veto HV Monitor |  |
| Veto LLD |  |
| Alpha Counter |  |
| _CPM_Rate |  |
| CZT Counter |  |
| +2.5 Volts monitor |  |
| +5 Volts monitor |  |
| _ROLL_ROT |  |
| _Roll_DEC |  |
| _Roll_RA |  |
| Veto Counter |  |