| Param | Original file | Final file |
|---|---|---|
| Filename | modeM0/AS1T02_086T01_9000002316cztM0_level2_bc.evt | modeM0/AS1T02_086T01_9000002316cztM0_level2_quad_clean.evt |
| Size (bytes) | 6,684,108,480 | 2,556,872,640 |
| Size | 6.2 GB | 2.4 GB |
| Events in quadrant A | 39,784,869 | 16,385,718 |
| Events in quadrant B | 41,981,554 | 16,558,542 |
| Events in quadrant C | 41,518,692 | 16,202,030 |
| Events in quadrant D | 66,490,804 | 15,571,477 |
| Mode M9 | |||
|---|---|---|---|
| Quadrant | BADHDUFLAG | Total packets | Discarded packets |
| A | 0 | 277 | 0 |
| B | 0 | 277 | 0 |
| C | 0 | 277 | 0 |
| D | 0 | 277 | 0 |
| Mode M0 | |||
|---|---|---|---|
| Quadrant | BADHDUFLAG | Total packets | Discarded packets |
| A | 0 | 388381 | 0 |
| B | 0 | 392716 | 0 |
| C | 0 | 397525 | 0 |
| D | 0 | 475876 | 0 |
| Mode SS | |||
|---|---|---|---|
| Quadrant | BADHDUFLAG | Total packets | Discarded packets |
| A | 0 | 3778 | 0 |
| B | 0 | 3778 | 0 |
| C | 0 | 3778 | 0 |
| D | 0 | 3778 | 0 |
| Quadrant | Total seconds | Saturated seconds | Saturation percentage |
|---|---|---|---|
| A | 185866 | 2427 | 1.305779% |
| B | 185866 | 2654 | 1.427910% |
| C | 185866 | 3241 | 1.743729% |
| D | 185866 | 8719 | 4.691014% |
Noise dominated data is calculated using 1-second bins in cleaned event files. If a bin has >2000 counts, and if more than 50% of those come from <1% of pixels, then it is considered to be noise-dominated and hence unusable.
| Quadrant | # 1 sec bins | Bins with >0 counts | Bins with >2000 counts | High rate bins dominated by noise | Noise dominated (total time) | Noise dominated (detector-on time) | Marked lightcurve |
|---|---|---|---|---|---|---|---|
| A | 213202 | 185842 | 28 | 28 | 0.01% | 0.02% |  |
| B | 213202 | 185845 | 33 | 33 | 0.02% | 0.02% |  |
| C | 213202 | 185847 | 10 | 10 | 0.00% | 0.01% |  |
| D | 213201 | 185846 | 2749 | 2749 | 1.29% | 1.48% |  |
Top three noisy pixels from each quadrant. If the there are fewer than three noisy pixels in the level2.evt file, extra rows are filled as -1
| Pixel properties | Quadrant properties | ||||||
|---|---|---|---|---|---|---|---|
| Quadrant | DetID | PixID | Counts | Sigma | Mean | Median | Sigma |
| A | 15 | 249 | 726328 | 339.68 | 9725 | 9562 | 2110.1 |
| A | 15 | 157 | 634743 | 296.28 | 9725 | 9562 | 2110.1 |
| A | 13 | 248 | 296018 | 135.75 | 9725 | 9562 | 2110.1 |
| B | 0 | 189 | 751413 | 407.6 | 9802 | 9569 | 1820.0 |
| B | 3 | 209 | 565338 | 305.36 | 9802 | 9569 | 1820.0 |
| B | 5 | 65 | 459002 | 246.94 | 9802 | 9569 | 1820.0 |
| C | 3 | 233 | 4612341 | 2094.36 | 9452 | 9415 | 2197.8 |
| C | 7 | 247 | 165133 | 70.85 | 9452 | 9415 | 2197.8 |
| C | 14 | 225 | 118895 | 49.81 | 9452 | 9415 | 2197.8 |
| D | 1 | 52 | 24798524 | 11311.4 | 9521 | 9194 | 2191.5 |
| D | 12 | 110 | 1393295 | 631.57 | 9521 | 9194 | 2191.5 |
| D | 15 | 0 | 766238 | 345.44 | 9521 | 9194 | 2191.5 |
Histogram calculated using DETX and DETY for each event in the final _common_clean file
| Quadrant A |  |
 |
Quadrant B |
|---|---|---|---|
| Quadrant D |  |
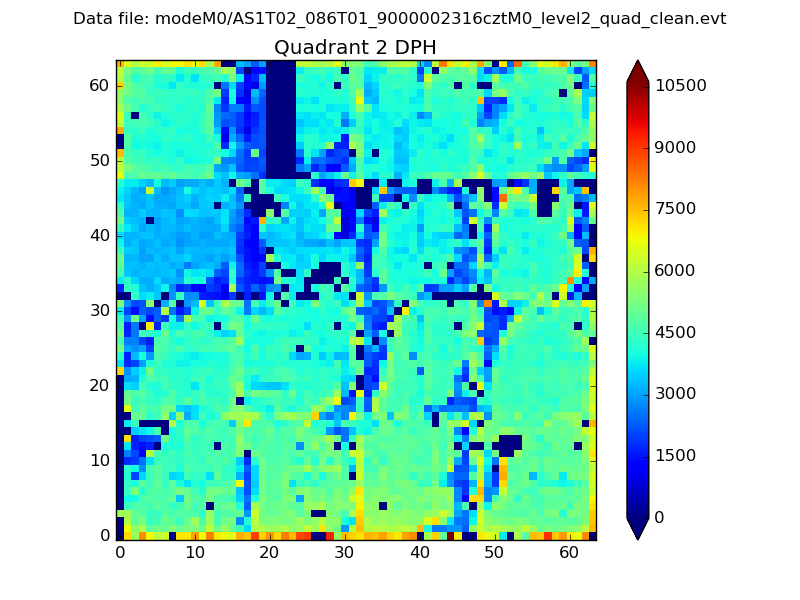 |
Quadrant C |
| Plot type | Count rate plots | Images |
|---|---|---|
| Comparison with Poisson distribution Blue bars denote a histogram of data divided into 1 sec bins. Red curve is a Poisson curve with rate = median count rate of data. |
 |
 |
| Quadrant-wise count rates Data is divided into 100 sec bins |
 |
|
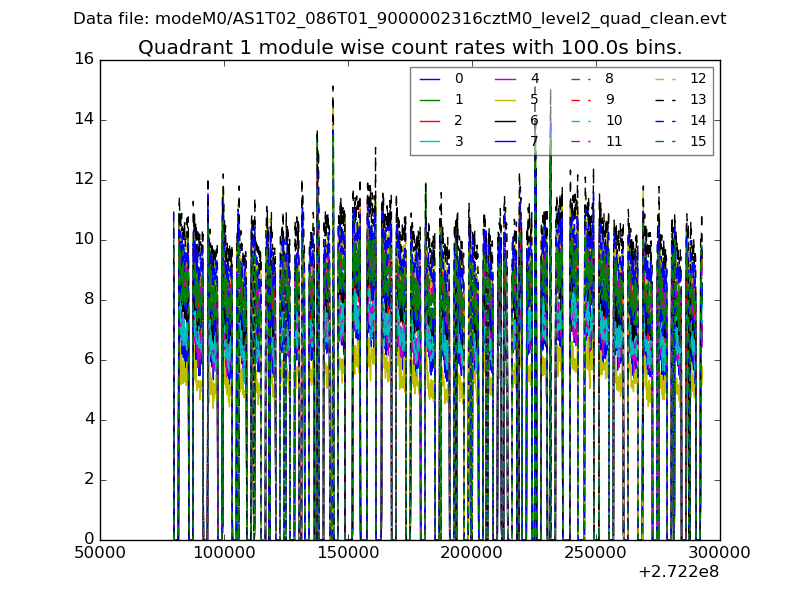
| Module-wise count rates for Quadrant A Data is divided into 100 sec bins |
 |
 |
| Module-wise count rates for Quadrant B Data is divided into 100 sec bins |
 |
 |
| Module-wise count rates for Quadrant C Data is divided into 100 sec bins |
 |
 |
| Module-wise count rates for Quadrant D Data is divided into 100 sec bins |
 |
 |
| Parameter | Plot |
|---|---|
| CZT HV Monitor |  |
| D_VDD |  |
| Temperature 1 |  |
| Veto HV Monitor |  |
| Veto LLD | 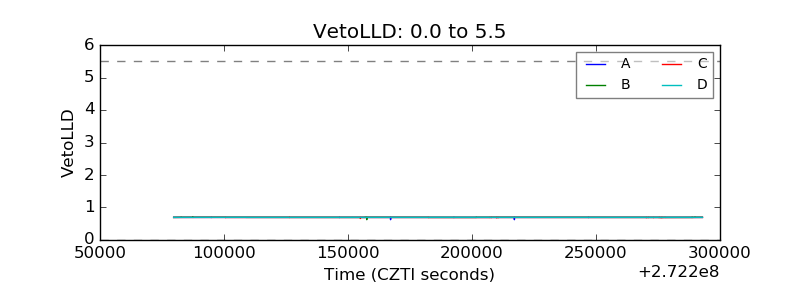 |
| Alpha Counter |  |
| _CPM_Rate |  |
| CZT Counter |  |
| +2.5 Volts monitor |  |
| +5 Volts monitor |  |
| _ROLL_ROT |  |
| _Roll_DEC |  |
| _Roll_RA |  |
| Veto Counter |  |