| Param | Original file | Final file |
|---|---|---|
| Filename | modeM0/AS1G08_031T01_9000002314cztM0_level2_bc.evt | modeM0/AS1G08_031T01_9000002314cztM0_level2_quad_clean.evt |
| Size (bytes) | 1,519,980,480 | 585,679,680 |
| Size | 1.4 GB | 558.5 MB |
| Events in quadrant A | 10,271,729 | 3,652,063 |
| Events in quadrant B | 11,621,334 | 3,690,136 |
| Events in quadrant C | 9,827,845 | 3,559,361 |
| Events in quadrant D | 11,015,500 | 3,523,678 |
| Mode M9 | |||
|---|---|---|---|
| Quadrant | BADHDUFLAG | Total packets | Discarded packets |
| A | 0 | 88 | 0 |
| B | 0 | 88 | 0 |
| C | 0 | 88 | 0 |
| D | 0 | 88 | 0 |
| Mode SS | |||
|---|---|---|---|
| Quadrant | BADHDUFLAG | Total packets | Discarded packets |
| A | 0 | 982 | 0 |
| B | 0 | 982 | 0 |
| C | 0 | 982 | 0 |
| D | 0 | 982 | 0 |
| Mode M0 | |||
|---|---|---|---|
| Quadrant | BADHDUFLAG | Total packets | Discarded packets |
| A | 0 | 100106 | 0 |
| B | 0 | 105505 | 0 |
| C | 0 | 100061 | 0 |
| D | 0 | 102334 | 0 |
| Quadrant | Total seconds | Saturated seconds | Saturation percentage |
|---|---|---|---|
| A | 48306 | 300 | 0.621041% |
| B | 48306 | 486 | 1.006086% |
| C | 48306 | 527 | 1.090962% |
| D | 48306 | 429 | 0.888088% |
Noise dominated data is calculated using 1-second bins in cleaned event files. If a bin has >2000 counts, and if more than 50% of those come from <1% of pixels, then it is considered to be noise-dominated and hence unusable.
| Quadrant | # 1 sec bins | Bins with >0 counts | Bins with >2000 counts | High rate bins dominated by noise | Noise dominated (total time) | Noise dominated (detector-on time) | Marked lightcurve |
|---|---|---|---|---|---|---|---|
| A | 56977 | 48304 | 4 | 4 | 0.01% | 0.01% | 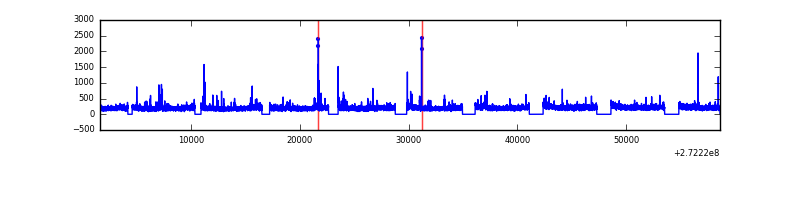 |
| B | 56977 | 48301 | 2 | 2 | 0.00% | 0.00% |  |
| C | 56977 | 48299 | 0 | 0 | 0.00% | 0.00% |  |
| D | 56977 | 48301 | 43 | 43 | 0.08% | 0.09% |  |
Top three noisy pixels from each quadrant. If the there are fewer than three noisy pixels in the level2.evt file, extra rows are filled as -1
| Pixel properties | Quadrant properties | ||||||
|---|---|---|---|---|---|---|---|
| Quadrant | DetID | PixID | Counts | Sigma | Mean | Median | Sigma |
| A | 0 | 253 | 189300 | 338.78 | 2576 | 2528 | 551.3 |
| A | 3 | 80 | 38375 | 65.02 | 2576 | 2528 | 551.3 |
| A | 7 | 16 | 38280 | 64.85 | 2576 | 2528 | 551.3 |
| B | 4 | 251 | 829240 | 1720.25 | 2583 | 2518 | 480.6 |
| B | 0 | 189 | 225200 | 463.36 | 2583 | 2518 | 480.6 |
| B | 4 | 173 | 183569 | 376.73 | 2583 | 2518 | 480.6 |
| C | 3 | 233 | 87757 | 146.47 | 2489 | 2474 | 582.3 |
| C | 7 | 247 | 84674 | 141.18 | 2489 | 2474 | 582.3 |
| C | 10 | 22 | 43170 | 69.89 | 2489 | 2474 | 582.3 |
| D | 12 | 110 | 285381 | 479.62 | 2559 | 2465 | 589.9 |
| D | 1 | 52 | 243368 | 408.39 | 2559 | 2465 | 589.9 |
| D | 2 | 234 | 217464 | 364.48 | 2559 | 2465 | 589.9 |
Histogram calculated using DETX and DETY for each event in the final _common_clean file
| Quadrant A |  |
 |
Quadrant B |
|---|---|---|---|
| Quadrant D |  |
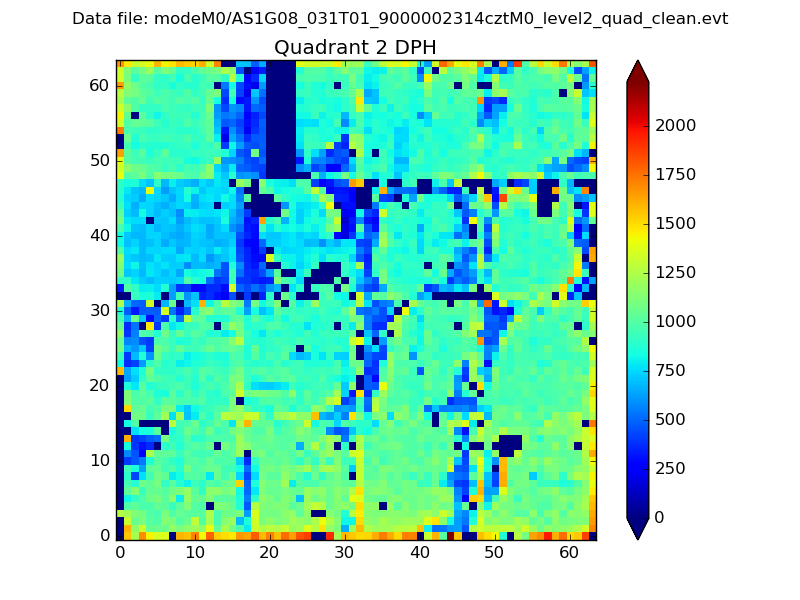 |
Quadrant C |
| Plot type | Count rate plots | Images |
|---|---|---|
| Comparison with Poisson distribution Blue bars denote a histogram of data divided into 1 sec bins. Red curve is a Poisson curve with rate = median count rate of data. |
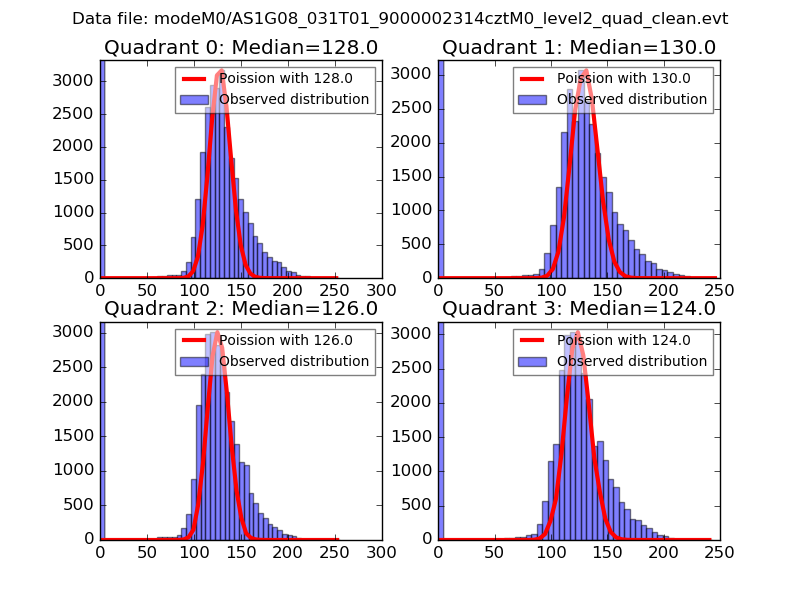 |
 |
| Quadrant-wise count rates Data is divided into 100 sec bins |
 |
|
| Module-wise count rates for Quadrant A Data is divided into 100 sec bins |
 |
 |
| Module-wise count rates for Quadrant B Data is divided into 100 sec bins |
 |
 |
| Module-wise count rates for Quadrant C Data is divided into 100 sec bins |
 |
 |
| Module-wise count rates for Quadrant D Data is divided into 100 sec bins |
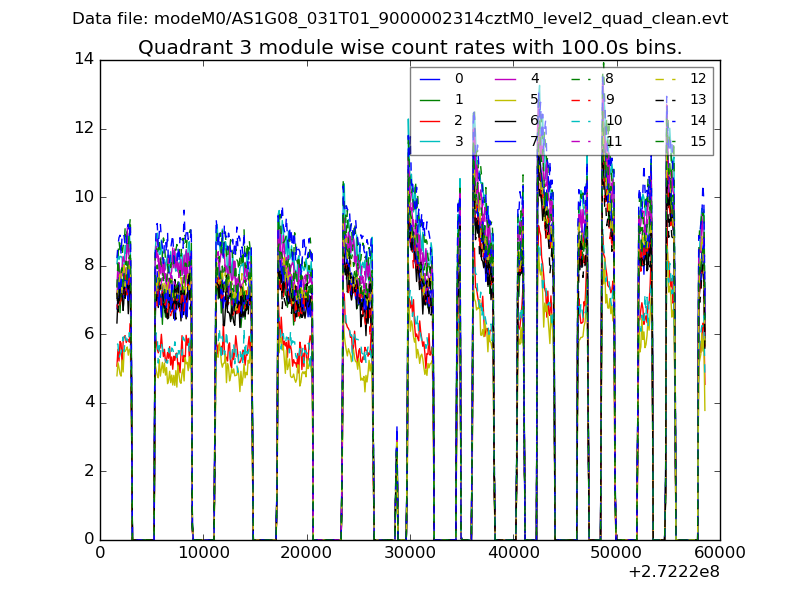 |
 |
| Parameter | Plot |
|---|---|
| CZT HV Monitor |  |
| D_VDD |  |
| Temperature 1 |  |
| Veto HV Monitor |  |
| Veto LLD |  |
| Alpha Counter | 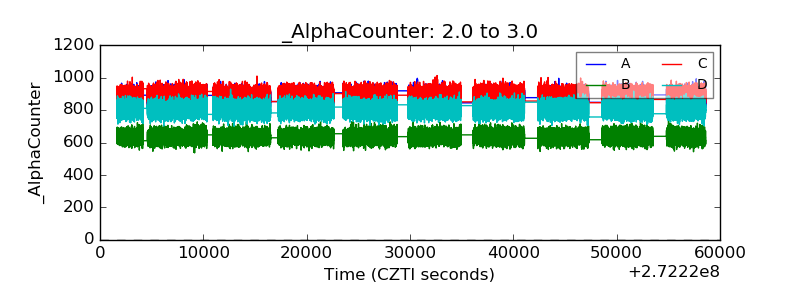 |
| _CPM_Rate |  |
| CZT Counter |  |
| +2.5 Volts monitor | 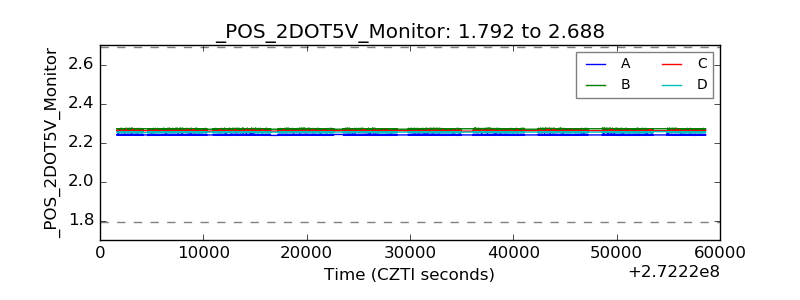 |
| +5 Volts monitor | 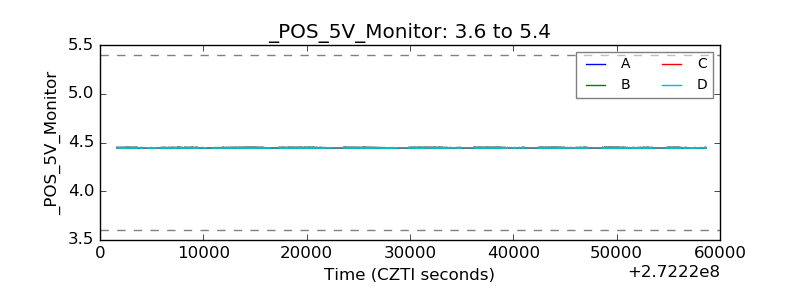 |
| _ROLL_ROT |  |
| _Roll_DEC | 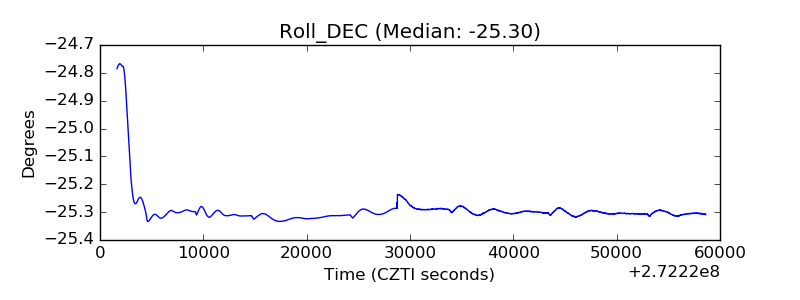 |
| _Roll_RA |  |
| Veto Counter | 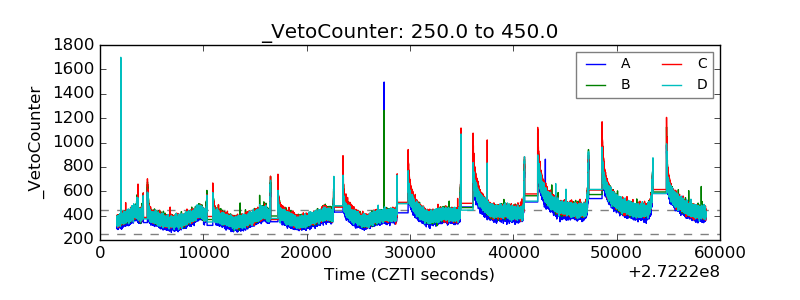 |