| Param | Original file | Final file |
|---|---|---|
| Filename | modeM0/AS1A04_037T01_9000002312cztM0_level2_bc.evt | modeM0/AS1A04_037T01_9000002312cztM0_level2_quad_clean.evt |
| Size (bytes) | 2,309,895,360 | 892,284,480 |
| Size | 2.2 GB | 850.9 MB |
| Events in quadrant A | 16,589,646 | 5,611,311 |
| Events in quadrant B | 16,961,541 | 5,717,349 |
| Events in quadrant C | 16,162,531 | 5,482,400 |
| Events in quadrant D | 15,485,715 | 5,432,329 |
| Mode M9 | |||
|---|---|---|---|
| Quadrant | BADHDUFLAG | Total packets | Discarded packets |
| A | 0 | 116 | 0 |
| B | 0 | 116 | 0 |
| C | 0 | 116 | 0 |
| D | 0 | 116 | 0 |
| Mode M0 | |||
|---|---|---|---|
| Quadrant | BADHDUFLAG | Total packets | Discarded packets |
| A | 0 | 150726 | 0 |
| B | 0 | 152566 | 0 |
| C | 0 | 151385 | 0 |
| D | 0 | 146698 | 0 |
| Mode SS | |||
|---|---|---|---|
| Quadrant | BADHDUFLAG | Total packets | Discarded packets |
| A | 0 | 1418 | 0 |
| B | 0 | 1418 | 0 |
| C | 0 | 1418 | 0 |
| D | 0 | 1418 | 0 |
| Quadrant | Total seconds | Saturated seconds | Saturation percentage |
|---|---|---|---|
| A | 69769 | 1134 | 1.625364% |
| B | 69769 | 982 | 1.407502% |
| C | 69769 | 1272 | 1.823159% |
| D | 69769 | 740 | 1.060643% |
Noise dominated data is calculated using 1-second bins in cleaned event files. If a bin has >2000 counts, and if more than 50% of those come from <1% of pixels, then it is considered to be noise-dominated and hence unusable.
| Quadrant | # 1 sec bins | Bins with >0 counts | Bins with >2000 counts | High rate bins dominated by noise | Noise dominated (total time) | Noise dominated (detector-on time) | Marked lightcurve |
|---|---|---|---|---|---|---|---|
| A | 81255 | 69760 | 105 | 105 | 0.13% | 0.15% |  |
| B | 81255 | 69765 | 3 | 3 | 0.00% | 0.00% |  |
| C | 81255 | 69761 | 17 | 17 | 0.02% | 0.02% |  |
| D | 81255 | 69764 | 19 | 19 | 0.02% | 0.03% |  |
Top three noisy pixels from each quadrant. If the there are fewer than three noisy pixels in the level2.evt file, extra rows are filled as -1
| Pixel properties | Quadrant properties | ||||||
|---|---|---|---|---|---|---|---|
| Quadrant | DetID | PixID | Counts | Sigma | Mean | Median | Sigma |
| A | 0 | 253 | 1506160 | 1896.26 | 3681 | 3606 | 792.4 |
| A | 4 | 2 | 757772 | 951.77 | 3681 | 3606 | 792.4 |
| A | 9 | 143 | 69200 | 82.78 | 3681 | 3606 | 792.4 |
| B | 4 | 251 | 1650375 | 2385.56 | 3703 | 3609 | 690.3 |
| B | 0 | 189 | 201877 | 287.22 | 3703 | 3609 | 690.3 |
| B | 0 | 214 | 144633 | 204.29 | 3703 | 3609 | 690.3 |
| C | 3 | 233 | 2171281 | 2605.67 | 3567 | 3549 | 831.9 |
| C | 7 | 247 | 111696 | 130.0 | 3567 | 3549 | 831.9 |
| C | 0 | 207 | 80159 | 92.09 | 3567 | 3549 | 831.9 |
| D | 2 | 234 | 318434 | 371.99 | 3677 | 3543 | 846.5 |
| D | 12 | 110 | 265851 | 309.87 | 3677 | 3543 | 846.5 |
| D | 10 | 70 | 254829 | 296.85 | 3677 | 3543 | 846.5 |
Histogram calculated using DETX and DETY for each event in the final _common_clean file
| Quadrant A |  |
 |
Quadrant B |
|---|---|---|---|
| Quadrant D | 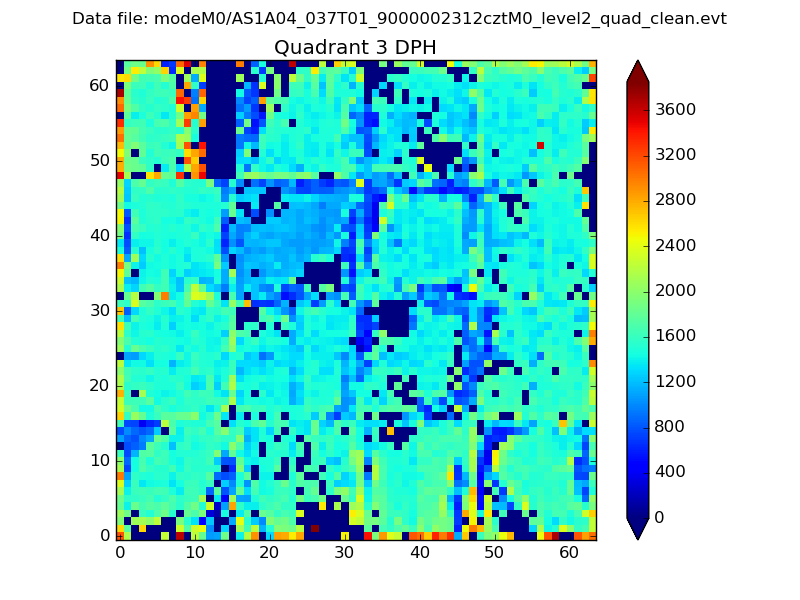 |
 |
Quadrant C |
| Plot type | Count rate plots | Images |
|---|---|---|
| Comparison with Poisson distribution Blue bars denote a histogram of data divided into 1 sec bins. Red curve is a Poisson curve with rate = median count rate of data. |
 |
 |
| Quadrant-wise count rates Data is divided into 100 sec bins |
 |
|
| Module-wise count rates for Quadrant A Data is divided into 100 sec bins |
 |
 |
| Module-wise count rates for Quadrant B Data is divided into 100 sec bins |
 |
 |
| Module-wise count rates for Quadrant C Data is divided into 100 sec bins |
 |
 |
| Module-wise count rates for Quadrant D Data is divided into 100 sec bins |
 |
 |
| Parameter | Plot |
|---|---|
| CZT HV Monitor |  |
| D_VDD |  |
| Temperature 1 |  |
| Veto HV Monitor | 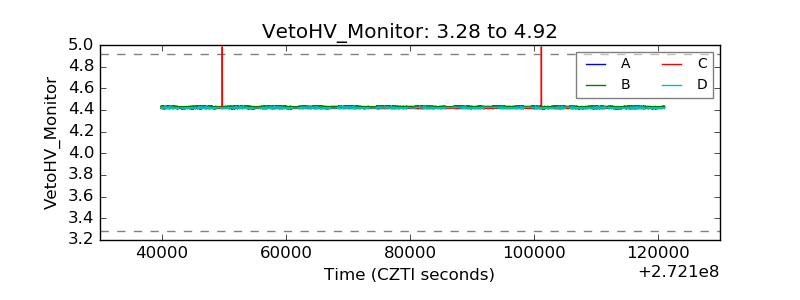 |
| Veto LLD |  |
| Alpha Counter |  |
| _CPM_Rate |  |
| CZT Counter |  |
| +2.5 Volts monitor | 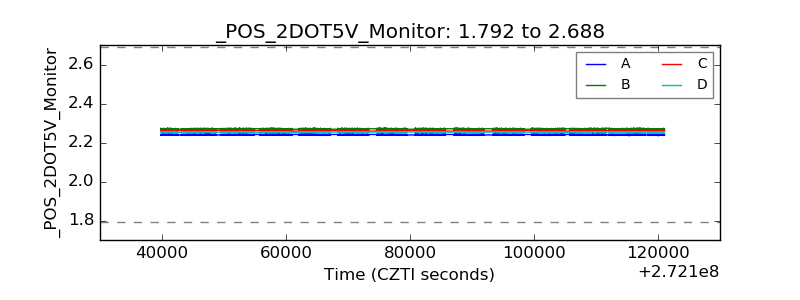 |
| +5 Volts monitor |  |
| _ROLL_ROT |  |
| _Roll_DEC |  |
| _Roll_RA |  |
| Veto Counter |  |