| Param | Original file | Final file |
|---|---|---|
| Filename | modeM0/AS1A04_037T02_9000002310cztM0_level2_bc.evt | modeM0/AS1A04_037T02_9000002310cztM0_level2_quad_clean.evt |
| Size (bytes) | 2,441,136,960 | 855,449,280 |
| Size | 2.3 GB | 815.8 MB |
| Events in quadrant A | 18,709,556 | 5,361,339 |
| Events in quadrant B | 15,129,954 | 5,489,515 |
| Events in quadrant C | 14,382,134 | 5,269,097 |
| Events in quadrant D | 21,081,829 | 5,135,277 |
| Mode SS | |||
|---|---|---|---|
| Quadrant | BADHDUFLAG | Total packets | Discarded packets |
| A | 0 | 1384 | 0 |
| B | 0 | 1384 | 0 |
| C | 0 | 1384 | 0 |
| D | 0 | 1384 | 0 |
| Mode M9 | |||
|---|---|---|---|
| Quadrant | BADHDUFLAG | Total packets | Discarded packets |
| A | 0 | 113 | 0 |
| B | 0 | 113 | 0 |
| C | 0 | 113 | 0 |
| D | 0 | 113 | 0 |
| Mode M0 | |||
|---|---|---|---|
| Quadrant | BADHDUFLAG | Total packets | Discarded packets |
| A | 0 | 155199 | 0 |
| B | 0 | 144164 | 0 |
| C | 0 | 142701 | 0 |
| D | 0 | 163783 | 0 |
| Quadrant | Total seconds | Saturated seconds | Saturation percentage |
|---|---|---|---|
| A | 67883 | 1547 | 2.278921% |
| B | 67883 | 1041 | 1.533521% |
| C | 67883 | 1081 | 1.592446% |
| D | 67883 | 1895 | 2.791568% |
Noise dominated data is calculated using 1-second bins in cleaned event files. If a bin has >2000 counts, and if more than 50% of those come from <1% of pixels, then it is considered to be noise-dominated and hence unusable.
| Quadrant | # 1 sec bins | Bins with >0 counts | Bins with >2000 counts | High rate bins dominated by noise | Noise dominated (total time) | Noise dominated (detector-on time) | Marked lightcurve |
|---|---|---|---|---|---|---|---|
| A | 79264 | 67882 | 168 | 168 | 0.21% | 0.25% |  |
| B | 79264 | 67875 | 7 | 7 | 0.01% | 0.01% |  |
| C | 79264 | 67876 | 0 | 0 | 0.00% | 0.00% |  |
| D | 79264 | 67877 | 194 | 194 | 0.24% | 0.29% | 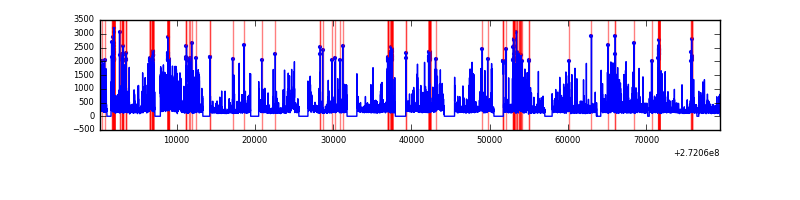 |
Top three noisy pixels from each quadrant. If the there are fewer than three noisy pixels in the level2.evt file, extra rows are filled as -1
| Pixel properties | Quadrant properties | ||||||
|---|---|---|---|---|---|---|---|
| Quadrant | DetID | PixID | Counts | Sigma | Mean | Median | Sigma |
| A | 0 | 253 | 4094575 | 5298.69 | 3605 | 3544 | 772.1 |
| A | 15 | 69 | 491682 | 632.23 | 3605 | 3544 | 772.1 |
| A | 15 | 157 | 103818 | 129.87 | 3605 | 3544 | 772.1 |
| B | 0 | 189 | 269496 | 392.31 | 3641 | 3549 | 677.9 |
| B | 4 | 48 | 214088 | 310.58 | 3641 | 3549 | 677.9 |
| B | 4 | 216 | 105731 | 150.73 | 3641 | 3549 | 677.9 |
| C | 3 | 233 | 767968 | 935.42 | 3503 | 3481 | 817.3 |
| C | 10 | 22 | 53155 | 60.78 | 3503 | 3481 | 817.3 |
| C | 0 | 207 | 36736 | 40.69 | 3503 | 3481 | 817.3 |
| D | 12 | 110 | 2620537 | 3204.78 | 3568 | 3446 | 816.6 |
| D | 1 | 52 | 1868607 | 2284.0 | 3568 | 3446 | 816.6 |
| D | 2 | 16 | 485939 | 590.84 | 3568 | 3446 | 816.6 |
Histogram calculated using DETX and DETY for each event in the final _common_clean file
| Quadrant A |  |
 |
Quadrant B |
|---|---|---|---|
| Quadrant D | 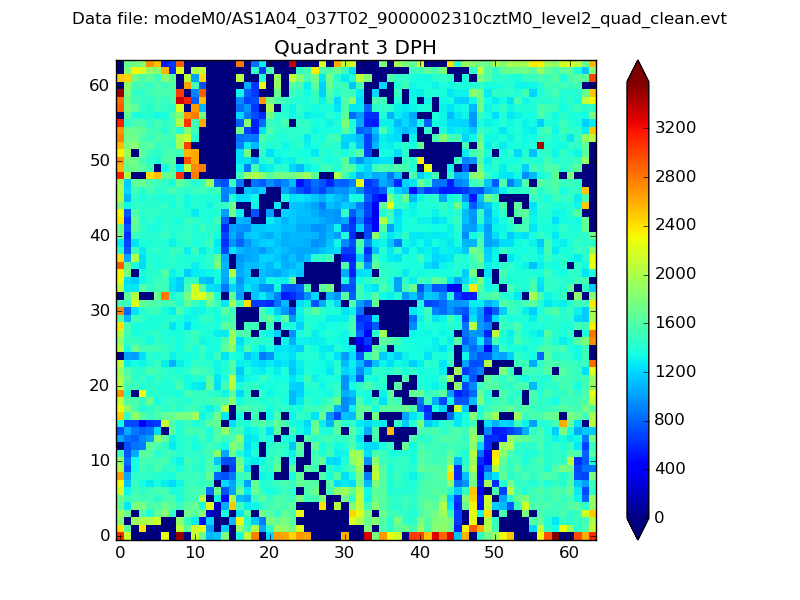 |
 |
Quadrant C |
| Plot type | Count rate plots | Images |
|---|---|---|
| Comparison with Poisson distribution Blue bars denote a histogram of data divided into 1 sec bins. Red curve is a Poisson curve with rate = median count rate of data. |
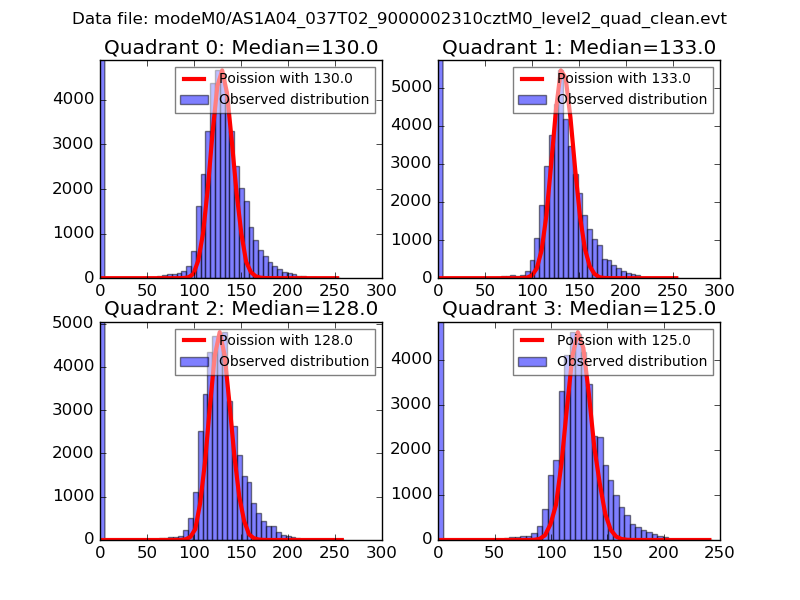 |
 |
| Quadrant-wise count rates Data is divided into 100 sec bins |
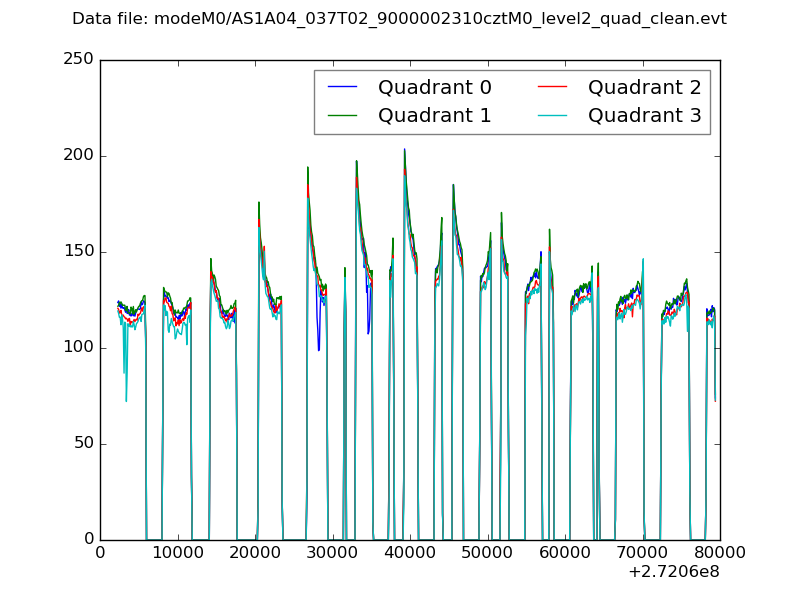 |
|
| Module-wise count rates for Quadrant A Data is divided into 100 sec bins |
 |
 |
| Module-wise count rates for Quadrant B Data is divided into 100 sec bins |
 |
 |
| Module-wise count rates for Quadrant C Data is divided into 100 sec bins |
 |
 |
| Module-wise count rates for Quadrant D Data is divided into 100 sec bins |
 |
 |
| Parameter | Plot |
|---|---|
| CZT HV Monitor | 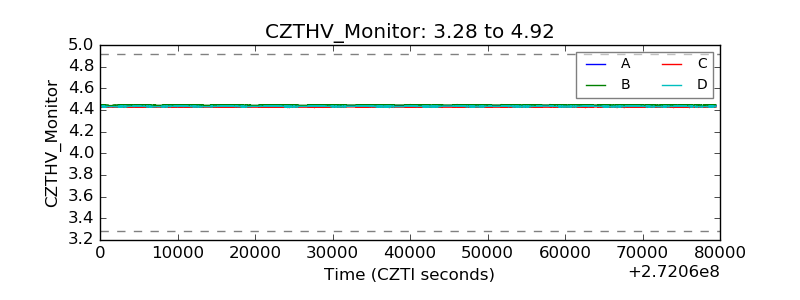 |
| D_VDD |  |
| Temperature 1 | 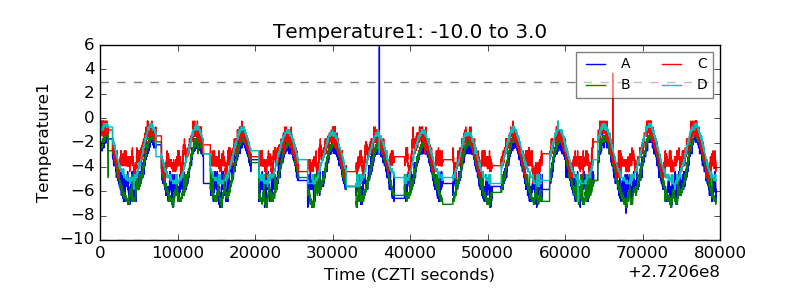 |
| Veto HV Monitor |  |
| Veto LLD |  |
| Alpha Counter |  |
| _CPM_Rate |  |
| CZT Counter |  |
| +2.5 Volts monitor |  |
| +5 Volts monitor | 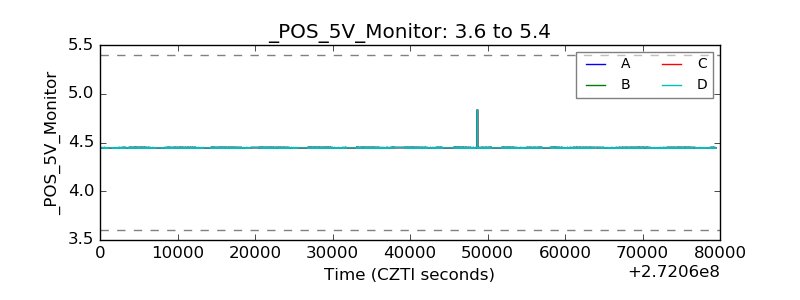 |
| _ROLL_ROT |  |
| _Roll_DEC |  |
| _Roll_RA | 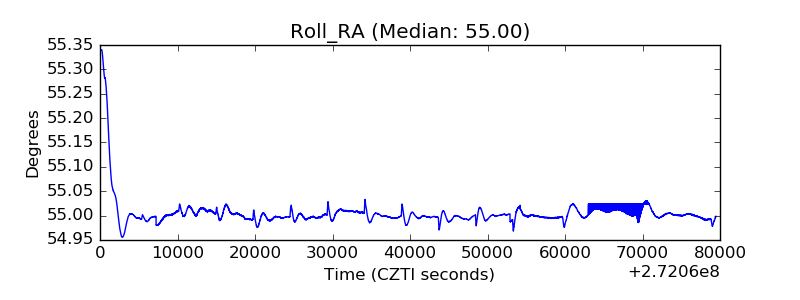 |
| Veto Counter |  |