| Param | Original file | Final file |
|---|---|---|
| Filename | modeM0/AS1T02_083T01_9000002304cztM0_level2_bc.evt | modeM0/AS1T02_083T01_9000002304cztM0_level2_quad_clean.evt |
| Size (bytes) | 640,523,520 | 257,365,440 |
| Size | 610.9 MB | 245.4 MB |
| Events in quadrant A | 4,012,441 | 1,679,476 |
| Events in quadrant B | 4,373,350 | 1,694,238 |
| Events in quadrant C | 4,073,132 | 1,648,976 |
| Events in quadrant D | 5,797,665 | 1,623,684 |
| Mode M0 | |||
|---|---|---|---|
| Quadrant | BADHDUFLAG | Total packets | Discarded packets |
| A | 0 | 35979 | 0 |
| B | 0 | 37371 | 0 |
| C | 0 | 37201 | 0 |
| D | 0 | 41467 | 0 |
| Mode SS | |||
|---|---|---|---|
| Quadrant | BADHDUFLAG | Total packets | Discarded packets |
| A | 0 | 342 | 0 |
| B | 0 | 342 | 0 |
| C | 0 | 342 | 0 |
| D | 0 | 342 | 0 |
| Mode M9 | |||
|---|---|---|---|
| Quadrant | BADHDUFLAG | Total packets | Discarded packets |
| A | 0 | 51 | 0 |
| B | 0 | 51 | 0 |
| C | 0 | 51 | 0 |
| D | 0 | 51 | 0 |
| Quadrant | Total seconds | Saturated seconds | Saturation percentage |
|---|---|---|---|
| A | 16658 | 291 | 1.746908% |
| B | 16658 | 344 | 2.065074% |
| C | 16658 | 476 | 2.857486% |
| D | 16658 | 935 | 5.612919% |
Noise dominated data is calculated using 1-second bins in cleaned event files. If a bin has >2000 counts, and if more than 50% of those come from <1% of pixels, then it is considered to be noise-dominated and hence unusable.
| Quadrant | # 1 sec bins | Bins with >0 counts | Bins with >2000 counts | High rate bins dominated by noise | Noise dominated (total time) | Noise dominated (detector-on time) | Marked lightcurve |
|---|---|---|---|---|---|---|---|
| A | 21799 | 16657 | 3 | 3 | 0.01% | 0.02% |  |
| B | 21799 | 16655 | 3 | 3 | 0.01% | 0.02% |  |
| C | 21799 | 16655 | 1 | 1 | 0.00% | 0.01% |  |
| D | 21799 | 16657 | 433 | 433 | 1.99% | 2.60% |  |
Top three noisy pixels from each quadrant. If the there are fewer than three noisy pixels in the level2.evt file, extra rows are filled as -1
| Pixel properties | Quadrant properties | ||||||
|---|---|---|---|---|---|---|---|
| Quadrant | DetID | PixID | Counts | Sigma | Mean | Median | Sigma |
| A | 0 | 253 | 34700 | 157.79 | 1023 | 1010 | 213.5 |
| A | 7 | 16 | 12862 | 55.51 | 1023 | 1010 | 213.5 |
| A | 15 | 222 | 10554 | 44.7 | 1023 | 1010 | 213.5 |
| B | 3 | 64 | 111941 | 592.84 | 1029 | 1011 | 187.1 |
| B | 0 | 189 | 87399 | 461.68 | 1029 | 1011 | 187.1 |
| B | 4 | 48 | 53141 | 278.6 | 1029 | 1011 | 187.1 |
| C | 3 | 233 | 209291 | 916.91 | 989 | 989 | 227.2 |
| C | 10 | 22 | 33843 | 144.62 | 989 | 989 | 227.2 |
| C | 0 | 207 | 15356 | 63.24 | 989 | 989 | 227.2 |
| D | 1 | 52 | 1693809 | 6758.05 | 981 | 958 | 250.5 |
| D | 13 | 172 | 92305 | 364.67 | 981 | 958 | 250.5 |
| D | 12 | 110 | 66809 | 262.88 | 981 | 958 | 250.5 |
Histogram calculated using DETX and DETY for each event in the final _common_clean file
| Quadrant A |  |
 |
Quadrant B |
|---|---|---|---|
| Quadrant D |  |
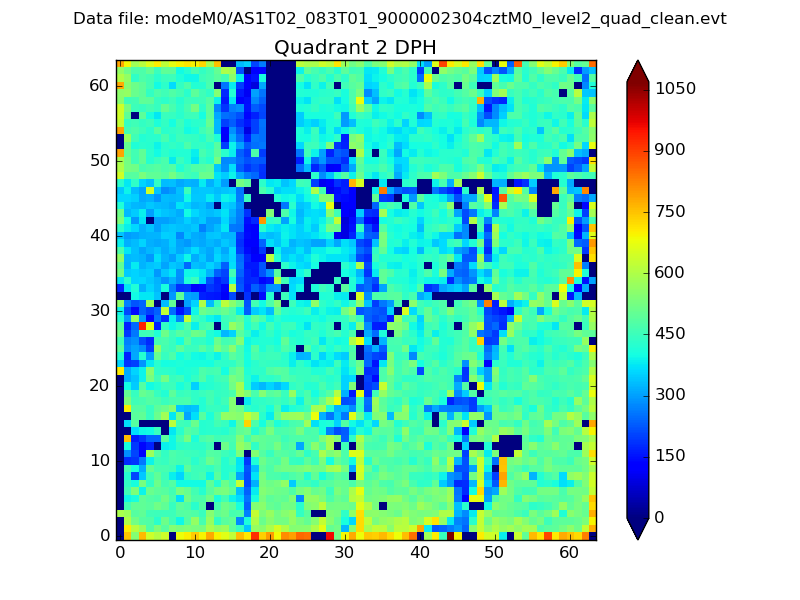 |
Quadrant C |
| Plot type | Count rate plots | Images |
|---|---|---|
| Comparison with Poisson distribution Blue bars denote a histogram of data divided into 1 sec bins. Red curve is a Poisson curve with rate = median count rate of data. |
 |
 |
| Quadrant-wise count rates Data is divided into 100 sec bins |
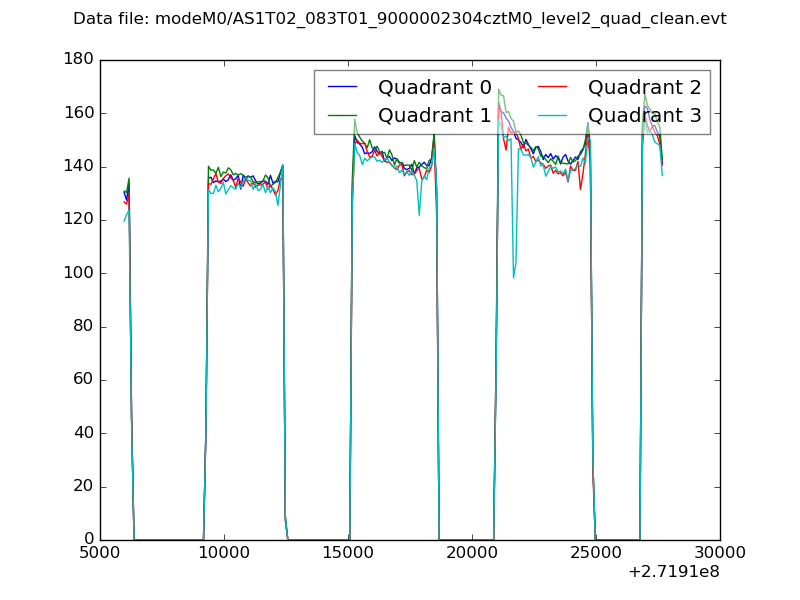 |
|
| Module-wise count rates for Quadrant A Data is divided into 100 sec bins |
 |
 |
| Module-wise count rates for Quadrant B Data is divided into 100 sec bins |
 |
 |
| Module-wise count rates for Quadrant C Data is divided into 100 sec bins |
 |
 |
| Module-wise count rates for Quadrant D Data is divided into 100 sec bins |
 |
 |
| Parameter | Plot |
|---|---|
| CZT HV Monitor |  |
| D_VDD |  |
| Temperature 1 |  |
| Veto HV Monitor |  |
| Veto LLD |  |
| Alpha Counter | 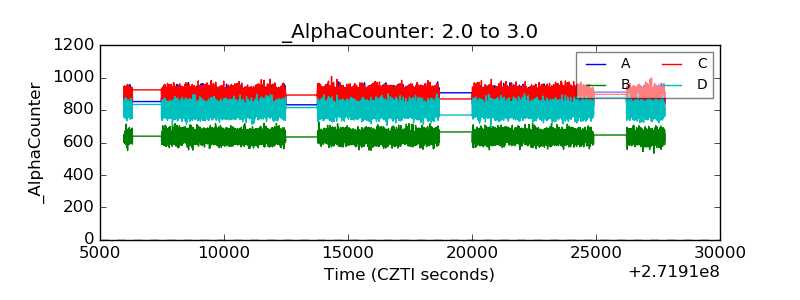 |
| _CPM_Rate | 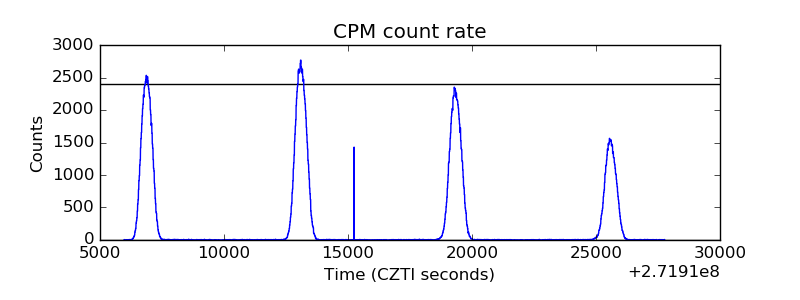 |
| CZT Counter |  |
| +2.5 Volts monitor |  |
| +5 Volts monitor | 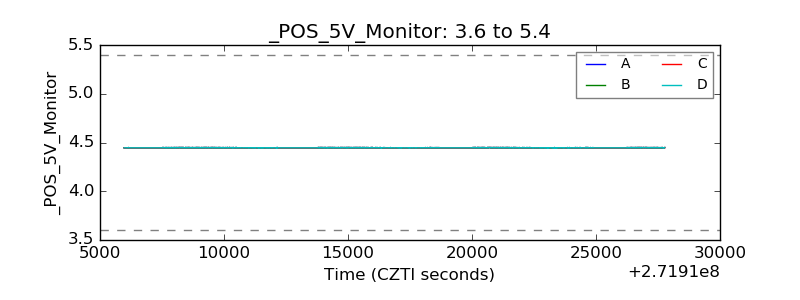 |
| _ROLL_ROT |  |
| _Roll_DEC |  |
| _Roll_RA |  |
| Veto Counter |  |