| Param | Original file | Final file |
|---|---|---|
| Filename | modeM0/AS1G08_028T01_9000002306cztM0_level2_bc.evt | modeM0/AS1G08_028T01_9000002306cztM0_level2_quad_clean.evt |
| Size (bytes) | 1,026,515,520 | 392,077,440 |
| Size | 979.0 MB | 373.9 MB |
| Events in quadrant A | 5,829,222 | 2,567,602 |
| Events in quadrant B | 6,501,636 | 2,578,177 |
| Events in quadrant C | 7,535,157 | 2,444,155 |
| Events in quadrant D | 9,332,892 | 2,385,543 |
| Mode M9 | |||
|---|---|---|---|
| Quadrant | BADHDUFLAG | Total packets | Discarded packets |
| A | 0 | 31 | 0 |
| B | 0 | 31 | 0 |
| C | 0 | 31 | 0 |
| D | 0 | 31 | 0 |
| Mode M0 | |||
|---|---|---|---|
| Quadrant | BADHDUFLAG | Total packets | Discarded packets |
| A | 0 | 58053 | 0 |
| B | 0 | 60348 | 0 |
| C | 0 | 64094 | 0 |
| D | 0 | 68843 | 0 |
| Mode SS | |||
|---|---|---|---|
| Quadrant | BADHDUFLAG | Total packets | Discarded packets |
| A | 0 | 566 | 0 |
| B | 0 | 566 | 0 |
| C | 0 | 566 | 0 |
| D | 0 | 566 | 0 |
| Quadrant | Total seconds | Saturated seconds | Saturation percentage |
|---|---|---|---|
| A | 27627 | 578 | 2.092156% |
| B | 27627 | 766 | 2.772650% |
| C | 27627 | 1571 | 5.686466% |
| D | 27627 | 1213 | 4.390632% |
Noise dominated data is calculated using 1-second bins in cleaned event files. If a bin has >2000 counts, and if more than 50% of those come from <1% of pixels, then it is considered to be noise-dominated and hence unusable.
| Quadrant | # 1 sec bins | Bins with >0 counts | Bins with >2000 counts | High rate bins dominated by noise | Noise dominated (total time) | Noise dominated (detector-on time) | Marked lightcurve |
|---|---|---|---|---|---|---|---|
| A | 30743 | 27629 | 3 | 3 | 0.01% | 0.01% |  |
| B | 30743 | 27625 | 2 | 2 | 0.01% | 0.01% |  |
| C | 30743 | 27627 | 52 | 52 | 0.17% | 0.19% |  |
| D | 30742 | 27626 | 324 | 324 | 1.05% | 1.17% |  |
Top three noisy pixels from each quadrant. If the there are fewer than three noisy pixels in the level2.evt file, extra rows are filled as -1
| Pixel properties | Quadrant properties | ||||||
|---|---|---|---|---|---|---|---|
| Quadrant | DetID | PixID | Counts | Sigma | Mean | Median | Sigma |
| A | 9 | 143 | 40216 | 119.11 | 1490 | 1461 | 325.4 |
| A | 15 | 223 | 25795 | 74.79 | 1490 | 1461 | 325.4 |
| A | 7 | 16 | 16853 | 47.31 | 1490 | 1461 | 325.4 |
| B | 4 | 48 | 210955 | 739.11 | 1492 | 1457 | 283.4 |
| B | 0 | 189 | 145787 | 509.2 | 1492 | 1457 | 283.4 |
| B | 3 | 64 | 75613 | 261.62 | 1492 | 1457 | 283.4 |
| C | 3 | 233 | 1961220 | 5935.32 | 1413 | 1407 | 330.2 |
| C | 7 | 247 | 44090 | 129.27 | 1413 | 1407 | 330.2 |
| C | 0 | 207 | 38339 | 111.85 | 1413 | 1407 | 330.2 |
| D | 15 | 0 | 1312617 | 3896.09 | 1452 | 1401 | 336.5 |
| D | 1 | 52 | 1070567 | 3176.87 | 1452 | 1401 | 336.5 |
| D | 5 | 222 | 302842 | 895.69 | 1452 | 1401 | 336.5 |
Histogram calculated using DETX and DETY for each event in the final _common_clean file
| Quadrant A |  |
 |
Quadrant B |
|---|---|---|---|
| Quadrant D |  |
 |
Quadrant C |
| Plot type | Count rate plots | Images |
|---|---|---|
| Comparison with Poisson distribution Blue bars denote a histogram of data divided into 1 sec bins. Red curve is a Poisson curve with rate = median count rate of data. |
 |
 |
| Quadrant-wise count rates Data is divided into 100 sec bins |
 |
|
| Module-wise count rates for Quadrant A Data is divided into 100 sec bins |
 |
 |
| Module-wise count rates for Quadrant B Data is divided into 100 sec bins |
 |
 |
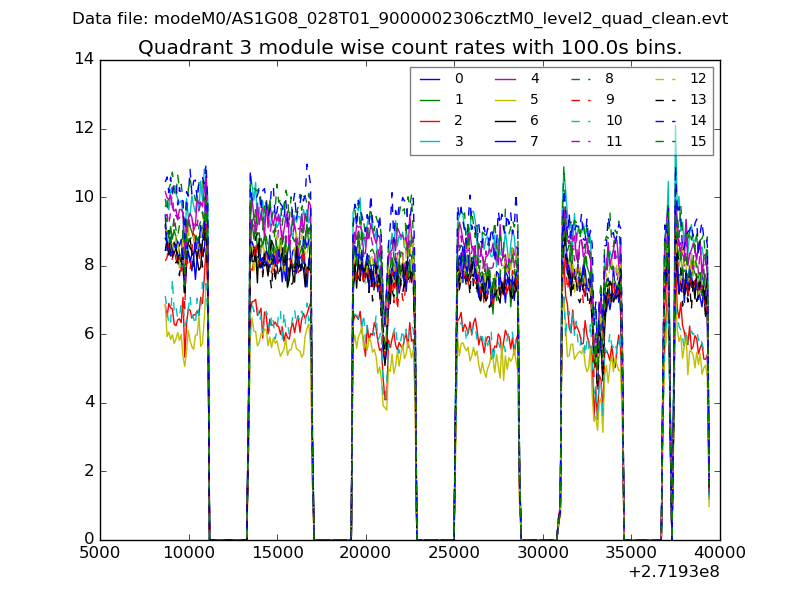
| Module-wise count rates for Quadrant C Data is divided into 100 sec bins |
 |
 |
| Module-wise count rates for Quadrant D Data is divided into 100 sec bins |
 |
 |
| Parameter | Plot |
|---|---|
| CZT HV Monitor |  |
| D_VDD |  |
| Temperature 1 | 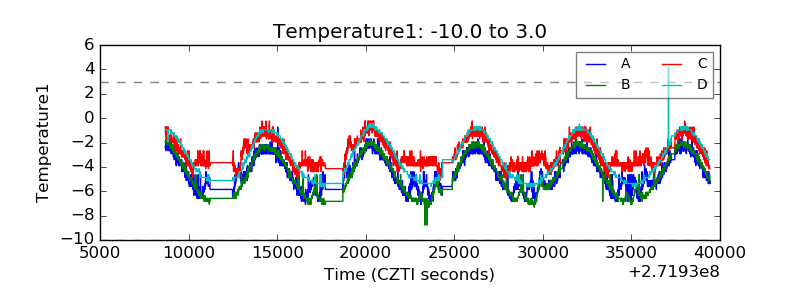 |
| Veto HV Monitor |  |
| Veto LLD |  |
| Alpha Counter |  |
| _CPM_Rate |  |
| CZT Counter | 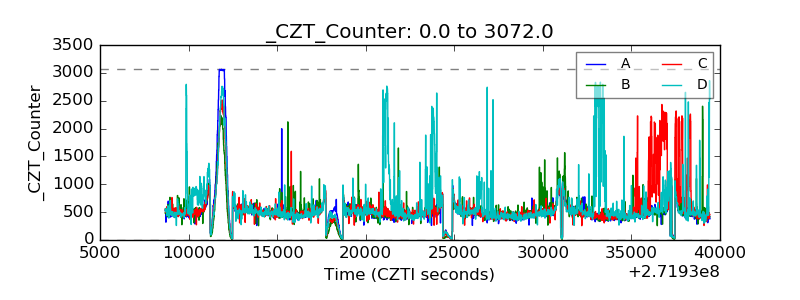 |
| +2.5 Volts monitor |  |
| +5 Volts monitor |  |
| _ROLL_ROT |  |
| _Roll_DEC |  |
| _Roll_RA |  |
| Veto Counter | 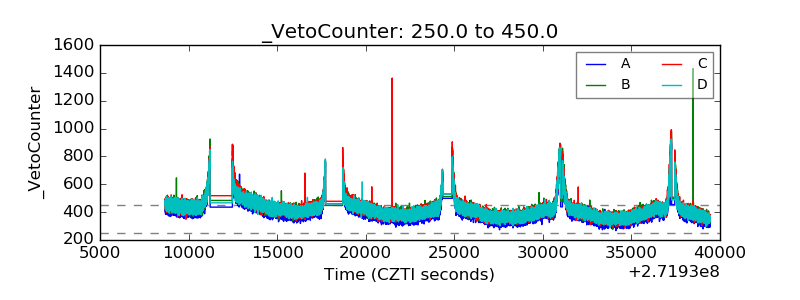 |