| Param | Original file | Final file |
|---|---|---|
| Filename | modeM0/AS1A04_198T01_9000002308cztM0_level2.evt | modeM0/AS1A04_198T01_9000002308cztM0_level2_quad_clean.evt |
| Size (bytes) | 5,562,849,600 | 1,015,793,280 |
| Size | 5.2 GB | 968.7 MB |
| Events in quadrant A | 36,774,390 | 6,461,251 |
| Events in quadrant B | 39,280,308 | 6,522,108 |
| Events in quadrant C | 38,170,737 | 6,315,419 |
| Events in quadrant D | 49,073,297 | 6,209,955 |
| Mode SS | |||
|---|---|---|---|
| Quadrant | BADHDUFLAG | Total packets | Discarded packets |
| A | 0 | 1564 | 0 |
| B | 0 | 1564 | 0 |
| C | 0 | 1564 | 0 |
| D | 0 | 1564 | 0 |
| Mode M9 | |||
|---|---|---|---|
| Quadrant | BADHDUFLAG | Total packets | Discarded packets |
| A | 0 | 121 | 0 |
| B | 0 | 121 | 0 |
| C | 0 | 121 | 0 |
| D | 0 | 121 | 0 |
| Mode M0 | |||
|---|---|---|---|
| Quadrant | BADHDUFLAG | Total packets | Discarded packets |
| A | 0 | 159012 | 0 |
| B | 0 | 165153 | 0 |
| C | 0 | 160905 | 0 |
| D | 0 | 196511 | 0 |
| Quadrant | Total seconds | Saturated seconds | Saturation percentage |
|---|---|---|---|
| A | 76713 | 815 | 1.062401% |
| B | 76713 | 1190 | 1.551236% |
| C | 76713 | 1153 | 1.503005% |
| D | 76713 | 3592 | 4.682388% |
Noise dominated data is calculated using 1-second bins in cleaned event files. If a bin has >2000 counts, and if more than 50% of those come from <1% of pixels, then it is considered to be noise-dominated and hence unusable.
| Quadrant | # 1 sec bins | Bins with >0 counts | Bins with >2000 counts | High rate bins dominated by noise | Noise dominated (total time) | Noise dominated (detector-on time) | Marked lightcurve |
|---|---|---|---|---|---|---|---|
| A | 88809 | 76724 | 24 | 24 | 0.03% | 0.03% | 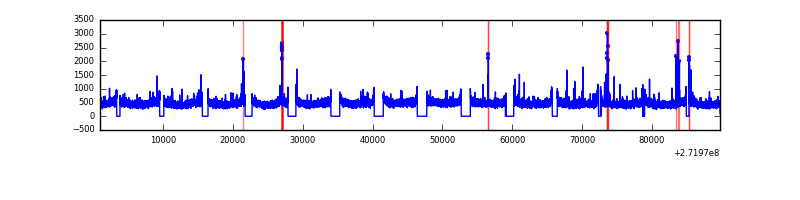 |
| B | 88809 | 76721 | 219 | 219 | 0.25% | 0.29% |  |
| C | 88809 | 76721 | 45 | 45 | 0.05% | 0.06% |  |
| D | 88809 | 76726 | 2820 | 2820 | 3.18% | 3.68% |  |
Top three noisy pixels from each quadrant. If the there are fewer than three noisy pixels in the level2.evt file, extra rows are filled as -1
| Pixel properties | Quadrant properties | ||||||
|---|---|---|---|---|---|---|---|
| Quadrant | DetID | PixID | Counts | Sigma | Mean | Median | Sigma |
| A | 14 | 238 | 202394 | 102.41 | 9449 | 9252 | 1886.1 |
| A | 13 | 248 | 115739 | 56.46 | 9449 | 9252 | 1886.1 |
| A | 0 | 226 | 84842 | 40.08 | 9449 | 9252 | 1886.1 |
| B | 3 | 64 | 680624 | 381.63 | 9387 | 9140 | 1759.5 |
| B | 5 | 65 | 589581 | 329.88 | 9387 | 9140 | 1759.5 |
| B | 0 | 189 | 372377 | 206.44 | 9387 | 9140 | 1759.5 |
| C | 14 | 238 | 1401284 | 661.32 | 9102 | 9159 | 2105.1 |
| C | 3 | 233 | 1128944 | 531.95 | 9102 | 9159 | 2105.1 |
| C | 0 | 207 | 93824 | 40.22 | 9102 | 9159 | 2105.1 |
| D | 5 | 222 | 5483190 | 2487.31 | 9143 | 8889 | 2200.9 |
| D | 1 | 52 | 3558517 | 1612.82 | 9143 | 8889 | 2200.9 |
| D | 12 | 110 | 2672908 | 1210.43 | 9143 | 8889 | 2200.9 |
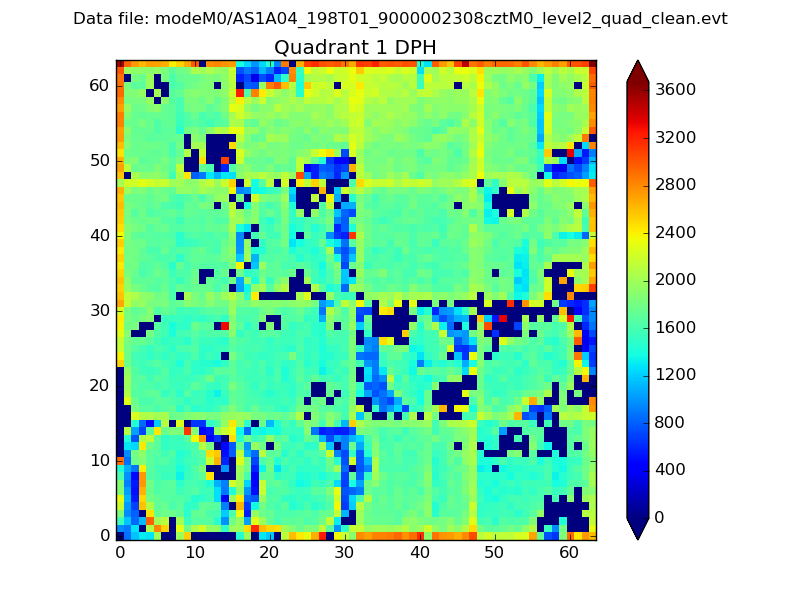
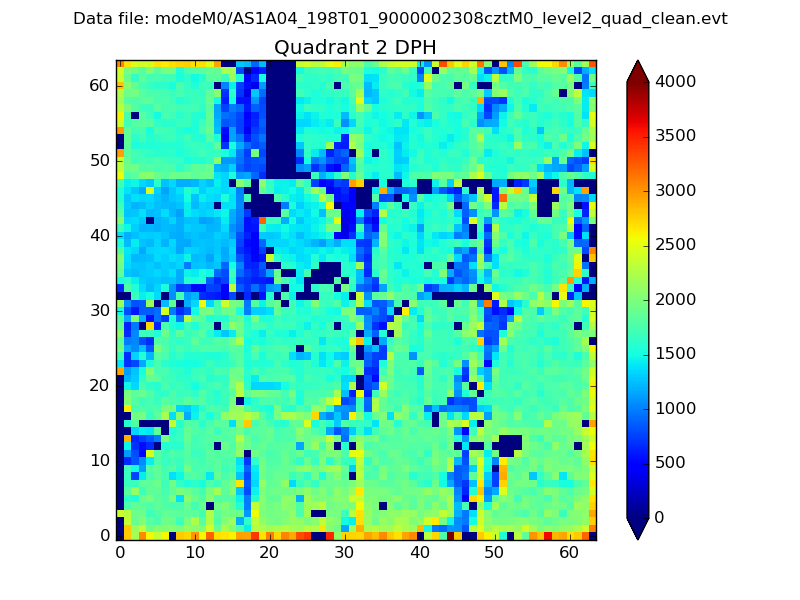
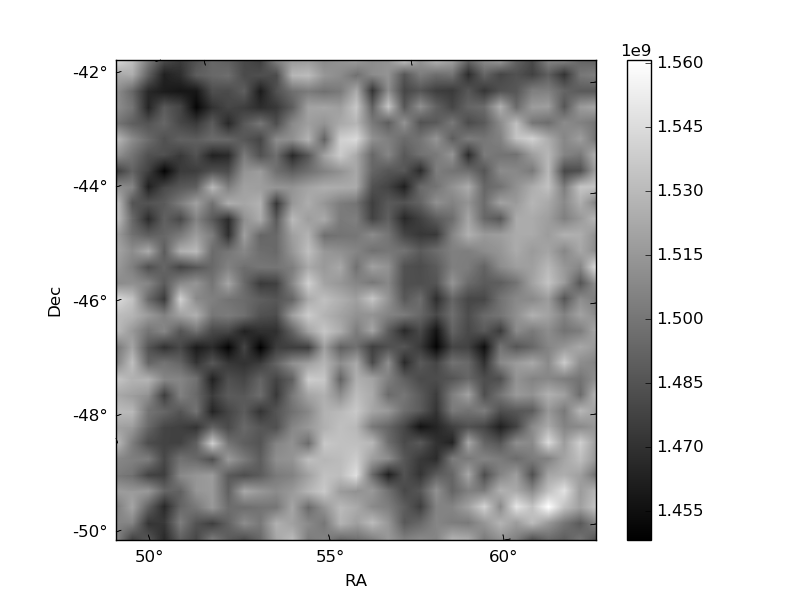
Histogram calculated using DETX and DETY for each event in the final _common_clean file
| Quadrant A |  |
 |
Quadrant B |
|---|---|---|---|
| Quadrant D | 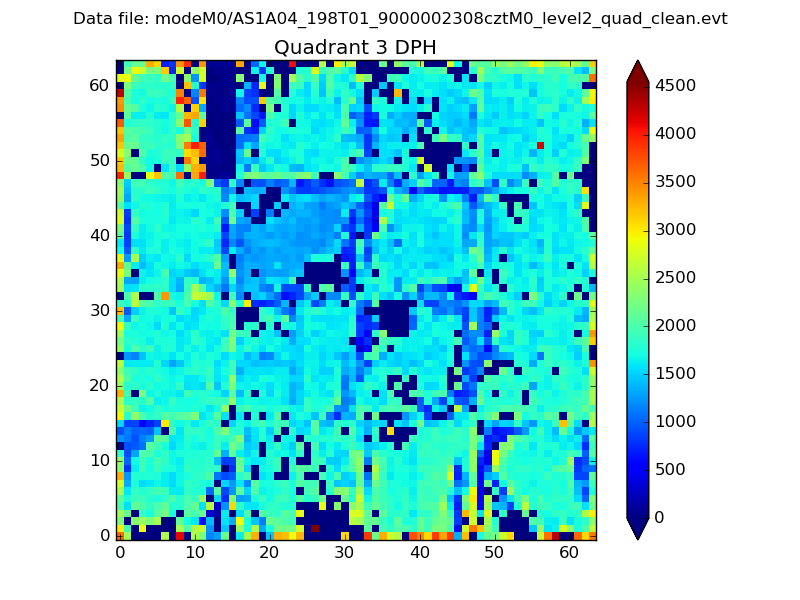 |
 |
Quadrant C |
| Plot type | Count rate plots | Images |
|---|---|---|
| Comparison with Poisson distribution Blue bars denote a histogram of data divided into 1 sec bins. Red curve is a Poisson curve with rate = median count rate of data. |
 |
 |
| Quadrant-wise count rates Data is divided into 100 sec bins |
 |
|
| Module-wise count rates for Quadrant A Data is divided into 100 sec bins |
 |
 |
| Module-wise count rates for Quadrant B Data is divided into 100 sec bins |
 |
 |
| Module-wise count rates for Quadrant C Data is divided into 100 sec bins |
 |
 |
| Module-wise count rates for Quadrant D Data is divided into 100 sec bins |
 |
 |
| Parameter | Plot |
|---|---|
| CZT HV Monitor |  |
| D_VDD |  |
| Temperature 1 |  |
| Veto HV Monitor | 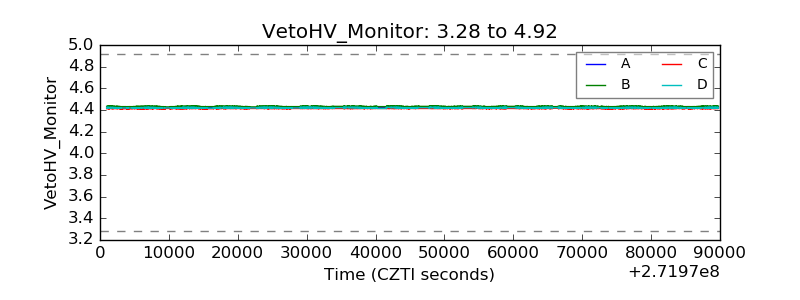 |
| Veto LLD |  |
| Alpha Counter |  |
| _CPM_Rate | 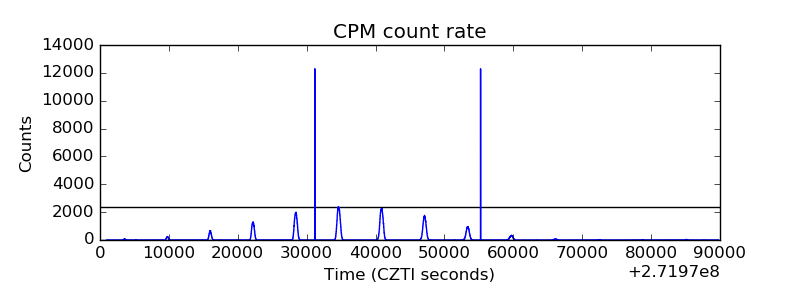 |
| CZT Counter |  |
| +2.5 Volts monitor | 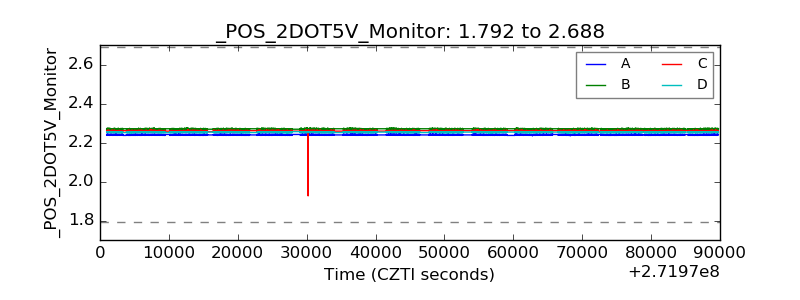 |
| +5 Volts monitor | 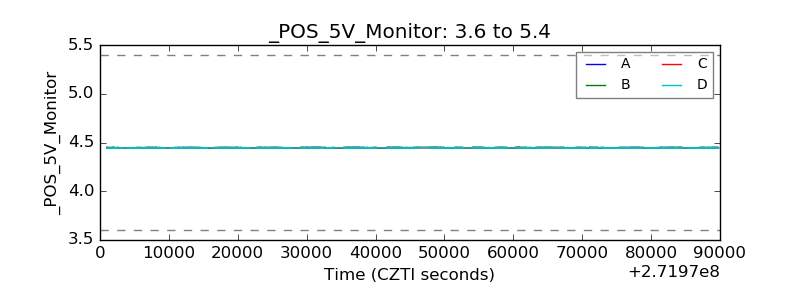 |
| _ROLL_ROT |  |
| _Roll_DEC |  |
| _Roll_RA |  |
| Veto Counter |  |