| Param | Original file | Final file |
|---|---|---|
| Filename | modeM0/AS1G08_030T01_9000002302cztM0_level2_bc.evt | modeM0/AS1G08_030T01_9000002302cztM0_level2_quad_clean.evt |
| Size (bytes) | 2,183,253,120 | 849,150,720 |
| Size | 2.0 GB | 809.8 MB |
| Events in quadrant A | 13,474,878 | 5,479,701 |
| Events in quadrant B | 15,751,419 | 5,482,437 |
| Events in quadrant C | 13,179,980 | 5,210,610 |
| Events in quadrant D | 19,326,153 | 5,135,354 |
| Mode M0 | |||
|---|---|---|---|
| Quadrant | BADHDUFLAG | Total packets | Discarded packets |
| A | 0 | 134543 | 0 |
| B | 0 | 142779 | 0 |
| C | 0 | 134694 | 0 |
| D | 0 | 152371 | 0 |
| Mode M9 | |||
|---|---|---|---|
| Quadrant | BADHDUFLAG | Total packets | Discarded packets |
| A | 0 | 98 | 0 |
| B | 0 | 98 | 0 |
| C | 0 | 98 | 0 |
| D | 0 | 98 | 0 |
| Mode SS | |||
|---|---|---|---|
| Quadrant | BADHDUFLAG | Total packets | Discarded packets |
| A | 0 | 1312 | 0 |
| B | 0 | 1312 | 0 |
| C | 0 | 1312 | 0 |
| D | 0 | 1312 | 0 |
| Quadrant | Total seconds | Saturated seconds | Saturation percentage |
|---|---|---|---|
| A | 64335 | 910 | 1.414471% |
| B | 64335 | 1593 | 2.476102% |
| C | 64335 | 1215 | 1.888552% |
| D | 64335 | 1980 | 3.077640% |
Noise dominated data is calculated using 1-second bins in cleaned event files. If a bin has >2000 counts, and if more than 50% of those come from <1% of pixels, then it is considered to be noise-dominated and hence unusable.
| Quadrant | # 1 sec bins | Bins with >0 counts | Bins with >2000 counts | High rate bins dominated by noise | Noise dominated (total time) | Noise dominated (detector-on time) | Marked lightcurve |
|---|---|---|---|---|---|---|---|
| A | 74126 | 64332 | 8 | 8 | 0.01% | 0.01% |  |
| B | 74126 | 64332 | 42 | 42 | 0.06% | 0.07% |  |
| C | 74126 | 64331 | 13 | 13 | 0.02% | 0.02% |  |
| D | 74126 | 64332 | 475 | 475 | 0.64% | 0.74% |  |
Top three noisy pixels from each quadrant. If the there are fewer than three noisy pixels in the level2.evt file, extra rows are filled as -1
| Pixel properties | Quadrant properties | ||||||
|---|---|---|---|---|---|---|---|
| Quadrant | DetID | PixID | Counts | Sigma | Mean | Median | Sigma |
| A | 0 | 253 | 170790 | 225.79 | 3442 | 3378 | 741.4 |
| A | 9 | 143 | 58805 | 74.76 | 3442 | 3378 | 741.4 |
| A | 15 | 249 | 30398 | 36.44 | 3442 | 3378 | 741.4 |
| B | 3 | 64 | 1668052 | 2581.65 | 3448 | 3368 | 644.8 |
| B | 4 | 48 | 264552 | 405.05 | 3448 | 3368 | 644.8 |
| B | 0 | 189 | 162059 | 246.1 | 3448 | 3368 | 644.8 |
| C | 3 | 233 | 274623 | 353.51 | 3285 | 3271 | 767.6 |
| C | 10 | 22 | 128515 | 163.16 | 3285 | 3271 | 767.6 |
| C | 10 | 187 | 57637 | 70.83 | 3285 | 3271 | 767.6 |
| D | 1 | 52 | 3082015 | 3635.61 | 3329 | 3235 | 846.8 |
| D | 5 | 222 | 1873685 | 2208.74 | 3329 | 3235 | 846.8 |
| D | 13 | 104 | 418855 | 490.79 | 3329 | 3235 | 846.8 |
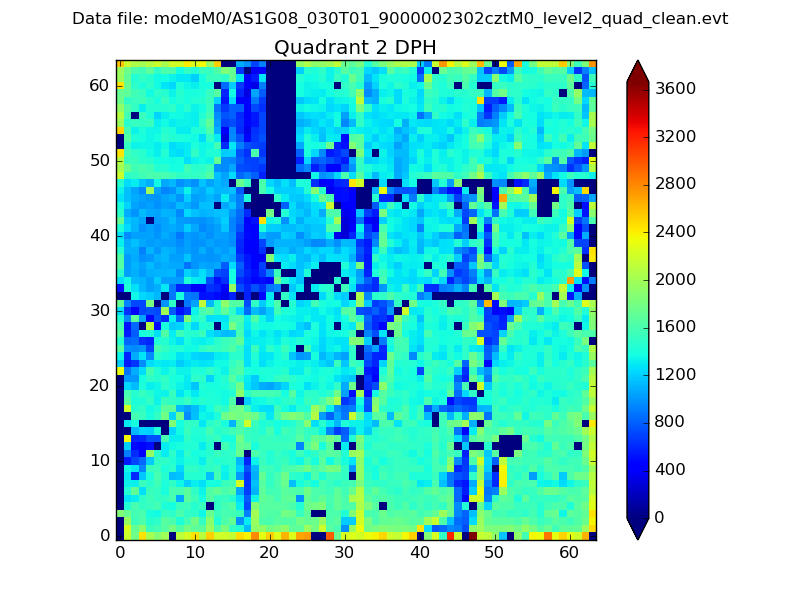
Histogram calculated using DETX and DETY for each event in the final _common_clean file
| Quadrant A |  |
 |
Quadrant B |
|---|---|---|---|
| Quadrant D |  |
 |
Quadrant C |
| Plot type | Count rate plots | Images |
|---|---|---|
| Comparison with Poisson distribution Blue bars denote a histogram of data divided into 1 sec bins. Red curve is a Poisson curve with rate = median count rate of data. |
 |
 |
| Quadrant-wise count rates Data is divided into 100 sec bins |
 |
|
| Module-wise count rates for Quadrant A Data is divided into 100 sec bins |
 |
 |
| Module-wise count rates for Quadrant B Data is divided into 100 sec bins |
 |
 |
| Module-wise count rates for Quadrant C Data is divided into 100 sec bins |
 |
 |
| Module-wise count rates for Quadrant D Data is divided into 100 sec bins |
 |
 |
| Parameter | Plot |
|---|---|
| CZT HV Monitor |  |
| D_VDD | 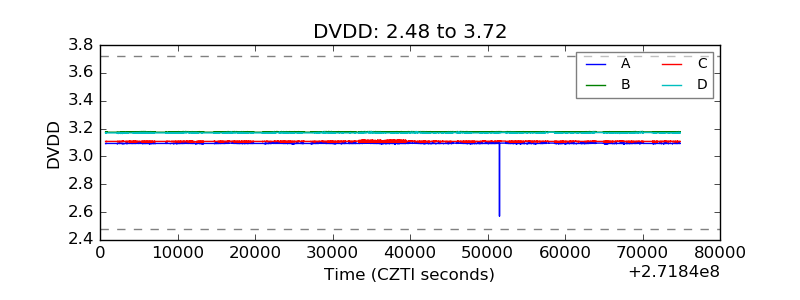 |
| Temperature 1 |  |
| Veto HV Monitor |  |
| Veto LLD |  |
| Alpha Counter |  |
| _CPM_Rate |  |
| CZT Counter |  |
| +2.5 Volts monitor |  |
| +5 Volts monitor |  |
| _ROLL_ROT |  |
| _Roll_DEC |  |
| _Roll_RA |  |
| Veto Counter |  |