| Param | Original file | Final file |
|---|---|---|
| Filename | modeM0/AS1T02_079T01_9000002298cztM0_level2_bc.evt | modeM0/AS1T02_079T01_9000002298cztM0_level2_quad_clean.evt |
| Size (bytes) | 725,137,920 | 283,740,480 |
| Size | 691.5 MB | 270.6 MB |
| Events in quadrant A | 4,940,756 | 1,779,466 |
| Events in quadrant B | 4,924,261 | 1,802,362 |
| Events in quadrant C | 4,855,662 | 1,741,682 |
| Events in quadrant D | 5,686,118 | 1,707,735 |
| Mode M9 | |||
|---|---|---|---|
| Quadrant | BADHDUFLAG | Total packets | Discarded packets |
| A | 0 | 27 | 0 |
| B | 0 | 27 | 0 |
| C | 0 | 27 | 0 |
| D | 0 | 27 | 0 |
| Mode SS | |||
|---|---|---|---|
| Quadrant | BADHDUFLAG | Total packets | Discarded packets |
| A | 0 | 462 | 0 |
| B | 0 | 462 | 0 |
| C | 0 | 462 | 0 |
| D | 0 | 462 | 0 |
| Mode M0 | |||
|---|---|---|---|
| Quadrant | BADHDUFLAG | Total packets | Discarded packets |
| A | 0 | 47417 | 0 |
| B | 0 | 47601 | 0 |
| C | 0 | 47601 | 0 |
| D | 0 | 50245 | 0 |
| Quadrant | Total seconds | Saturated seconds | Saturation percentage |
|---|---|---|---|
| A | 22715 | 228 | 1.003742% |
| B | 22715 | 147 | 0.647149% |
| C | 22715 | 243 | 1.069778% |
| D | 22715 | 155 | 0.682368% |
Noise dominated data is calculated using 1-second bins in cleaned event files. If a bin has >2000 counts, and if more than 50% of those come from <1% of pixels, then it is considered to be noise-dominated and hence unusable.
| Quadrant | # 1 sec bins | Bins with >0 counts | Bins with >2000 counts | High rate bins dominated by noise | Noise dominated (total time) | Noise dominated (detector-on time) | Marked lightcurve |
|---|---|---|---|---|---|---|---|
| A | 25281 | 22715 | 71 | 71 | 0.28% | 0.31% |  |
| B | 25281 | 22716 | 1 | 1 | 0.00% | 0.00% |  |
| C | 25281 | 22716 | 1 | 1 | 0.00% | 0.00% | 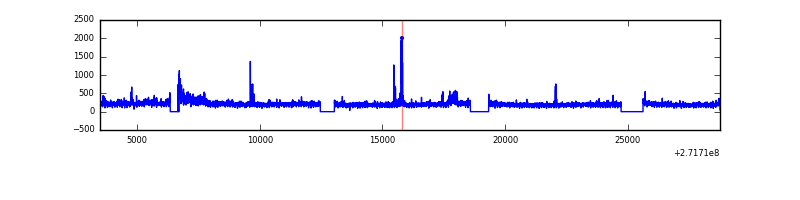 |
| D | 25281 | 22715 | 12 | 12 | 0.05% | 0.05% |  |
Top three noisy pixels from each quadrant. If the there are fewer than three noisy pixels in the level2.evt file, extra rows are filled as -1
| Pixel properties | Quadrant properties | ||||||
|---|---|---|---|---|---|---|---|
| Quadrant | DetID | PixID | Counts | Sigma | Mean | Median | Sigma |
| A | 0 | 253 | 494713 | 1988.76 | 1125 | 1100 | 248.2 |
| A | 9 | 143 | 74176 | 294.42 | 1125 | 1100 | 248.2 |
| A | 14 | 238 | 39878 | 156.24 | 1125 | 1100 | 248.2 |
| B | 4 | 173 | 94730 | 425.21 | 1138 | 1110 | 220.2 |
| B | 0 | 189 | 55592 | 247.45 | 1138 | 1110 | 220.2 |
| B | 4 | 190 | 50774 | 225.57 | 1138 | 1110 | 220.2 |
| C | 3 | 233 | 532203 | 2070.14 | 1083 | 1075 | 256.6 |
| C | 9 | 54 | 86635 | 333.48 | 1083 | 1075 | 256.6 |
| C | 10 | 187 | 23828 | 88.68 | 1083 | 1075 | 256.6 |
| D | 12 | 221 | 550762 | 2115.76 | 1108 | 1065 | 259.8 |
| D | 5 | 222 | 386861 | 1484.91 | 1108 | 1065 | 259.8 |
| D | 7 | 38 | 158547 | 606.14 | 1108 | 1065 | 259.8 |
Histogram calculated using DETX and DETY for each event in the final _common_clean file
| Quadrant A |  |
 |
Quadrant B |
|---|---|---|---|
| Quadrant D |  |
 |
Quadrant C |
| Plot type | Count rate plots | Images |
|---|---|---|
| Comparison with Poisson distribution Blue bars denote a histogram of data divided into 1 sec bins. Red curve is a Poisson curve with rate = median count rate of data. |
 |
 |
| Quadrant-wise count rates Data is divided into 100 sec bins |
 |
|
| Module-wise count rates for Quadrant A Data is divided into 100 sec bins |
 |
 |
| Module-wise count rates for Quadrant B Data is divided into 100 sec bins |
 |
 |
| Module-wise count rates for Quadrant C Data is divided into 100 sec bins |
 |
 |
| Module-wise count rates for Quadrant D Data is divided into 100 sec bins |
 |
 |
| Parameter | Plot |
|---|---|
| CZT HV Monitor |  |
| D_VDD |  |
| Temperature 1 |  |
| Veto HV Monitor |  |
| Veto LLD |  |
| Alpha Counter | 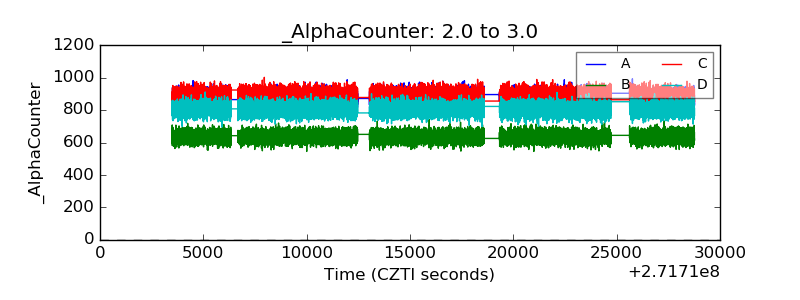 |
| _CPM_Rate |  |
| CZT Counter |  |
| +2.5 Volts monitor | 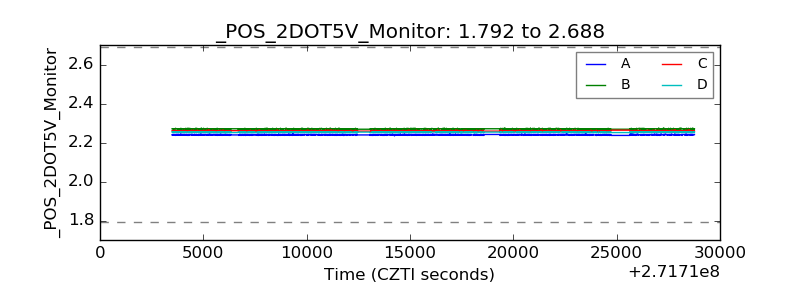 |
| +5 Volts monitor |  |
| _ROLL_ROT |  |
| _Roll_DEC | 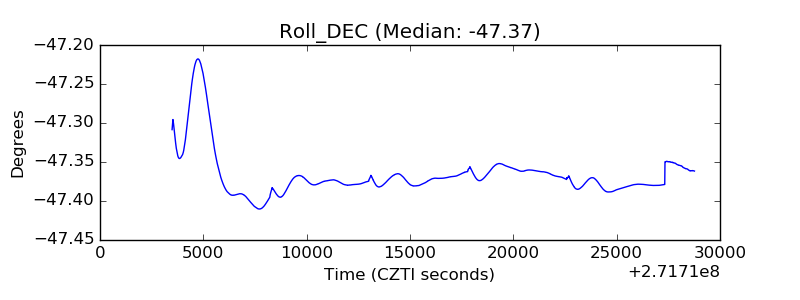 |
| _Roll_RA |  |
| Veto Counter |  |