| Param | Original file | Final file |
|---|---|---|
| Filename | modeM0/AS1T02_085T01_9000002296cztM0_level2_bc.evt | modeM0/AS1T02_085T01_9000002296cztM0_level2_quad_clean.evt |
| Size (bytes) | 4,256,818,560 | 1,398,997,440 |
| Size | 4.0 GB | 1.3 GB |
| Events in quadrant A | 28,279,950 | 8,921,144 |
| Events in quadrant B | 24,648,008 | 9,051,299 |
| Events in quadrant C | 25,913,249 | 8,724,049 |
| Events in quadrant D | 42,937,122 | 8,489,262 |
| Mode SS | |||
|---|---|---|---|
| Quadrant | BADHDUFLAG | Total packets | Discarded packets |
| A | 0 | 2138 | 0 |
| B | 0 | 2138 | 0 |
| C | 0 | 2138 | 0 |
| D | 0 | 2138 | 0 |
| Mode M0 | |||
|---|---|---|---|
| Quadrant | BADHDUFLAG | Total packets | Discarded packets |
| A | 0 | 242816 | 0 |
| B | 0 | 225722 | 0 |
| C | 0 | 229844 | 0 |
| D | 0 | 293573 | 0 |
| Mode M9 | |||
|---|---|---|---|
| Quadrant | BADHDUFLAG | Total packets | Discarded packets |
| A | 0 | 174 | 0 |
| B | 0 | 174 | 0 |
| C | 0 | 174 | 0 |
| D | 0 | 174 | 0 |
| Quadrant | Total seconds | Saturated seconds | Saturation percentage |
|---|---|---|---|
| A | 104890 | 3179 | 3.030794% |
| B | 104890 | 1591 | 1.516827% |
| C | 104890 | 1765 | 1.682715% |
| D | 104890 | 6379 | 6.081609% |
Noise dominated data is calculated using 1-second bins in cleaned event files. If a bin has >2000 counts, and if more than 50% of those come from <1% of pixels, then it is considered to be noise-dominated and hence unusable.
| Quadrant | # 1 sec bins | Bins with >0 counts | Bins with >2000 counts | High rate bins dominated by noise | Noise dominated (total time) | Noise dominated (detector-on time) | Marked lightcurve |
|---|---|---|---|---|---|---|---|
| A | 121206 | 104887 | 112 | 112 | 0.09% | 0.11% |  |
| B | 121207 | 104892 | 12 | 12 | 0.01% | 0.01% |  |
| C | 121206 | 104891 | 2 | 2 | 0.00% | 0.00% | 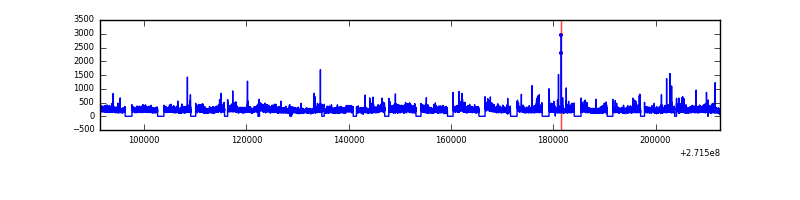 |
| D | 121206 | 104885 | 918 | 918 | 0.76% | 0.88% |  |
Top three noisy pixels from each quadrant. If the there are fewer than three noisy pixels in the level2.evt file, extra rows are filled as -1
| Pixel properties | Quadrant properties | ||||||
|---|---|---|---|---|---|---|---|
| Quadrant | DetID | PixID | Counts | Sigma | Mean | Median | Sigma |
| A | 14 | 238 | 3502184 | 2947.92 | 5567 | 5473 | 1186.2 |
| A | 0 | 253 | 2063013 | 1734.62 | 5567 | 5473 | 1186.2 |
| A | 14 | 237 | 988014 | 828.34 | 5567 | 5473 | 1186.2 |
| B | 0 | 189 | 557327 | 531.93 | 5621 | 5493 | 1037.4 |
| B | 4 | 142 | 507286 | 483.7 | 5621 | 5493 | 1037.4 |
| B | 0 | 229 | 230473 | 216.87 | 5621 | 5493 | 1037.4 |
| C | 3 | 233 | 4671373 | 3677.12 | 5417 | 5402 | 1268.9 |
| C | 0 | 207 | 165280 | 126.0 | 5417 | 5402 | 1268.9 |
| C | 7 | 247 | 137788 | 104.33 | 5417 | 5402 | 1268.9 |
| D | 1 | 52 | 11587748 | 9166.15 | 5449 | 5273 | 1263.6 |
| D | 5 | 222 | 5017643 | 3966.69 | 5449 | 5273 | 1263.6 |
| D | 12 | 221 | 3450474 | 2726.47 | 5449 | 5273 | 1263.6 |
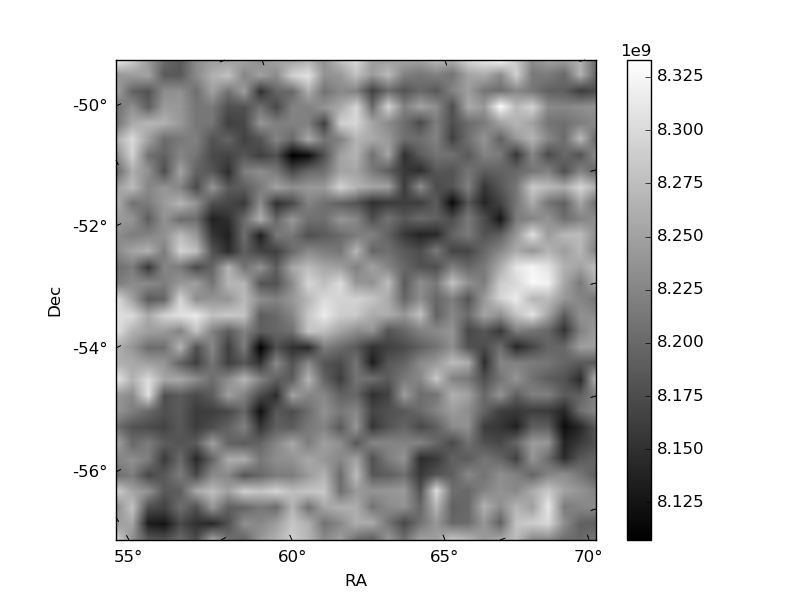
Histogram calculated using DETX and DETY for each event in the final _common_clean file
| Quadrant A |  |
 |
Quadrant B |
|---|---|---|---|
| Quadrant D |  |
 |
Quadrant C |
| Plot type | Count rate plots | Images |
|---|---|---|
| Comparison with Poisson distribution Blue bars denote a histogram of data divided into 1 sec bins. Red curve is a Poisson curve with rate = median count rate of data. |
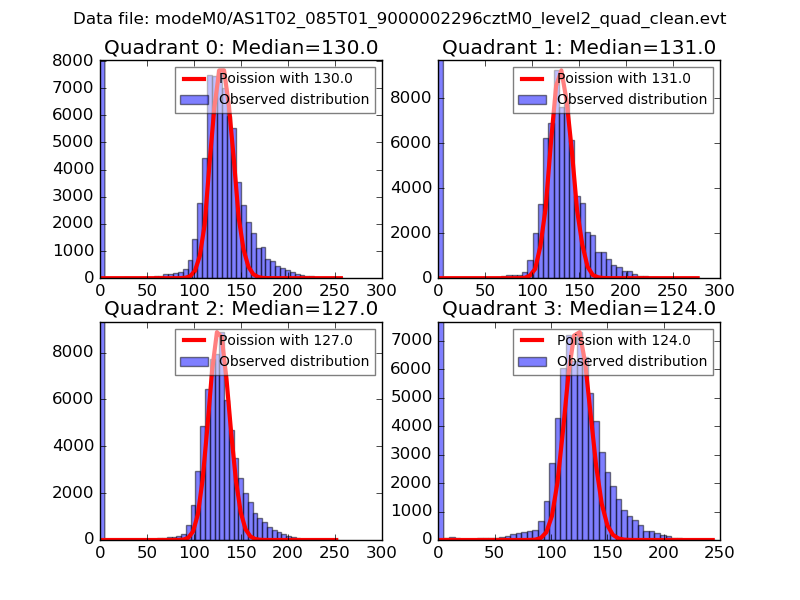 |
 |
| Quadrant-wise count rates Data is divided into 100 sec bins |
 |
|
| Module-wise count rates for Quadrant A Data is divided into 100 sec bins |
 |
 |
| Module-wise count rates for Quadrant B Data is divided into 100 sec bins |
 |
 |
| Module-wise count rates for Quadrant C Data is divided into 100 sec bins |
 |
 |
| Module-wise count rates for Quadrant D Data is divided into 100 sec bins |
 |
 |
| Parameter | Plot |
|---|---|
| CZT HV Monitor |  |
| D_VDD |  |
| Temperature 1 | 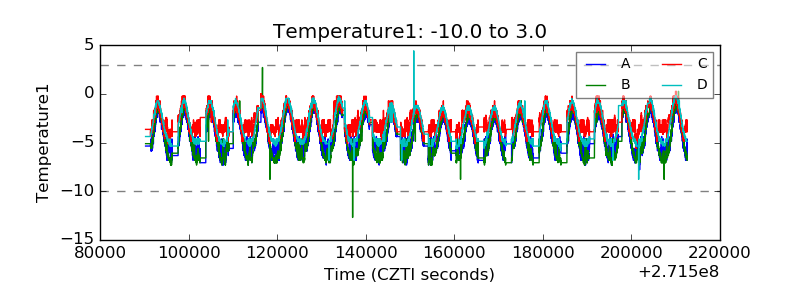 |
| Veto HV Monitor |  |
| Veto LLD |  |
| Alpha Counter |  |
| _CPM_Rate | 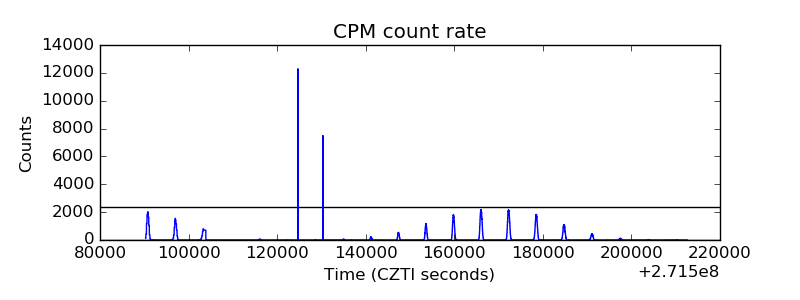 |
| CZT Counter |  |
| +2.5 Volts monitor |  |
| +5 Volts monitor | 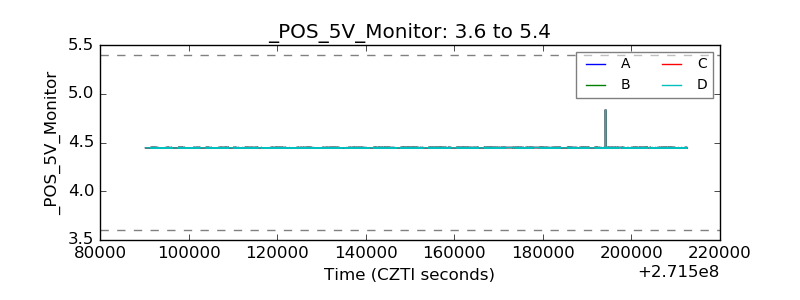 |
| _ROLL_ROT |  |
| _Roll_DEC |  |
| _Roll_RA |  |
| Veto Counter |  |