| Param | Original file | Final file |
|---|---|---|
| Filename | modeM0/AS1T02_078T01_9000002294cztM0_level2_bc.evt | modeM0/AS1T02_078T01_9000002294cztM0_level2_quad_clean.evt |
| Size (bytes) | 599,716,800 | 232,508,160 |
| Size | 571.9 MB | 221.7 MB |
| Events in quadrant A | 4,029,814 | 1,508,980 |
| Events in quadrant B | 3,973,664 | 1,534,409 |
| Events in quadrant C | 3,853,718 | 1,495,460 |
| Events in quadrant D | 5,257,171 | 1,448,057 |
| Mode M9 | |||
|---|---|---|---|
| Quadrant | BADHDUFLAG | Total packets | Discarded packets |
| A | 0 | 35 | 0 |
| B | 0 | 35 | 0 |
| C | 0 | 35 | 0 |
| D | 0 | 35 | 0 |
| Mode M0 | |||
|---|---|---|---|
| Quadrant | BADHDUFLAG | Total packets | Discarded packets |
| A | 0 | 34649 | 0 |
| B | 0 | 34008 | 0 |
| C | 0 | 33916 | 0 |
| D | 0 | 38031 | 0 |
| Mode SS | |||
|---|---|---|---|
| Quadrant | BADHDUFLAG | Total packets | Discarded packets |
| A | 0 | 312 | 0 |
| B | 0 | 312 | 0 |
| C | 0 | 312 | 0 |
| D | 0 | 312 | 0 |
| Quadrant | Total seconds | Saturated seconds | Saturation percentage |
|---|---|---|---|
| A | 15295 | 301 | 1.967963% |
| B | 15295 | 184 | 1.203008% |
| C | 15295 | 238 | 1.556064% |
| D | 15295 | 427 | 2.791762% |
Noise dominated data is calculated using 1-second bins in cleaned event files. If a bin has >2000 counts, and if more than 50% of those come from <1% of pixels, then it is considered to be noise-dominated and hence unusable.
| Quadrant | # 1 sec bins | Bins with >0 counts | Bins with >2000 counts | High rate bins dominated by noise | Noise dominated (total time) | Noise dominated (detector-on time) | Marked lightcurve |
|---|---|---|---|---|---|---|---|
| A | 18801 | 15295 | 7 | 7 | 0.04% | 0.05% | 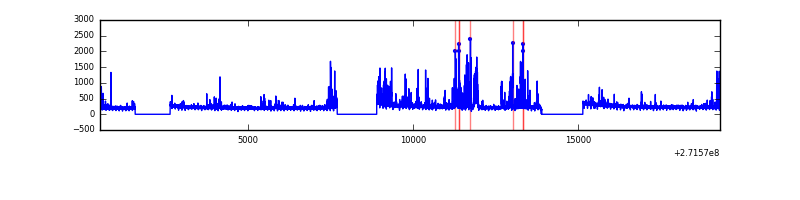 |
| B | 18801 | 15294 | 3 | 3 | 0.02% | 0.02% |  |
| C | 18801 | 15295 | 0 | 0 | 0.00% | 0.00% |  |
| D | 18801 | 15294 | 94 | 94 | 0.50% | 0.61% | 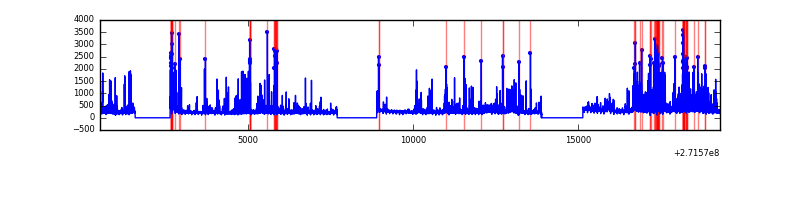 |
Top three noisy pixels from each quadrant. If the there are fewer than three noisy pixels in the level2.evt file, extra rows are filled as -1
| Pixel properties | Quadrant properties | ||||||
|---|---|---|---|---|---|---|---|
| Quadrant | DetID | PixID | Counts | Sigma | Mean | Median | Sigma |
| A | 14 | 238 | 479530 | 2548.24 | 878 | 865 | 187.8 |
| A | 0 | 253 | 87694 | 462.24 | 878 | 865 | 187.8 |
| A | 14 | 237 | 58517 | 306.92 | 878 | 865 | 187.8 |
| B | 10 | 245 | 179816 | 1089.16 | 887 | 869 | 164.3 |
| B | 4 | 142 | 94345 | 568.94 | 887 | 869 | 164.3 |
| B | 0 | 189 | 83354 | 502.04 | 887 | 869 | 164.3 |
| C | 3 | 233 | 535865 | 2704.56 | 853 | 853 | 197.8 |
| C | 0 | 207 | 15127 | 72.16 | 853 | 853 | 197.8 |
| C | 7 | 247 | 12268 | 57.7 | 853 | 853 | 197.8 |
| D | 1 | 52 | 1133139 | 5692.26 | 868 | 842 | 198.9 |
| D | 5 | 222 | 176895 | 885.05 | 868 | 842 | 198.9 |
| D | 7 | 223 | 158275 | 791.44 | 868 | 842 | 198.9 |
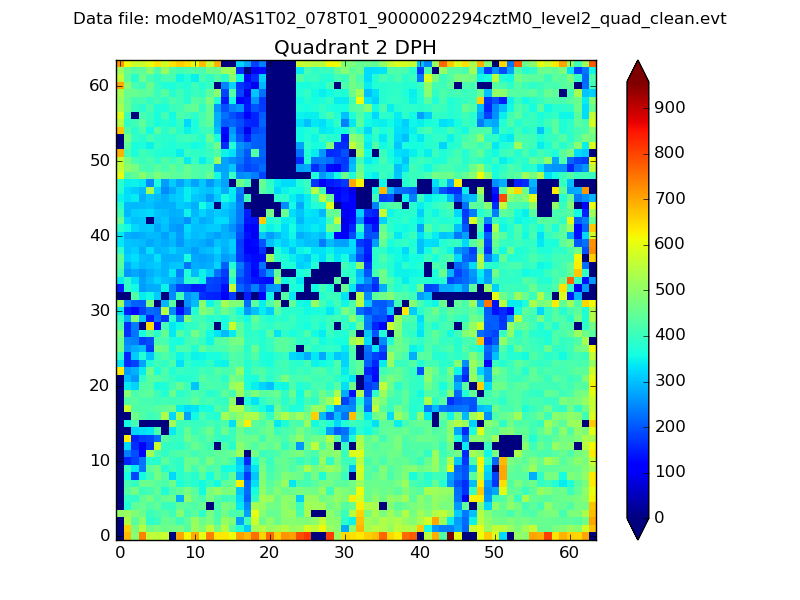
Histogram calculated using DETX and DETY for each event in the final _common_clean file
| Quadrant A |  |
 |
Quadrant B |
|---|---|---|---|
| Quadrant D |  |
 |
Quadrant C |
| Plot type | Count rate plots | Images |
|---|---|---|
| Comparison with Poisson distribution Blue bars denote a histogram of data divided into 1 sec bins. Red curve is a Poisson curve with rate = median count rate of data. |
 |
 |
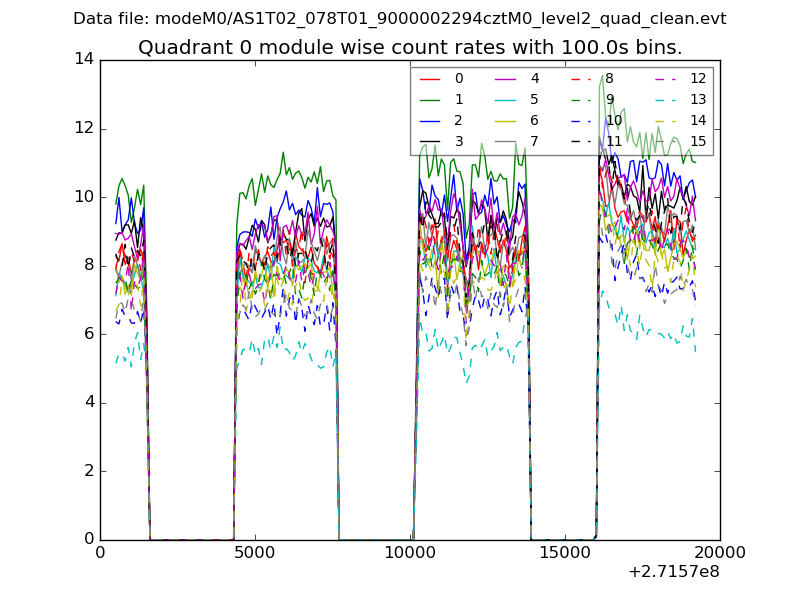
| Quadrant-wise count rates Data is divided into 100 sec bins |
 |
|
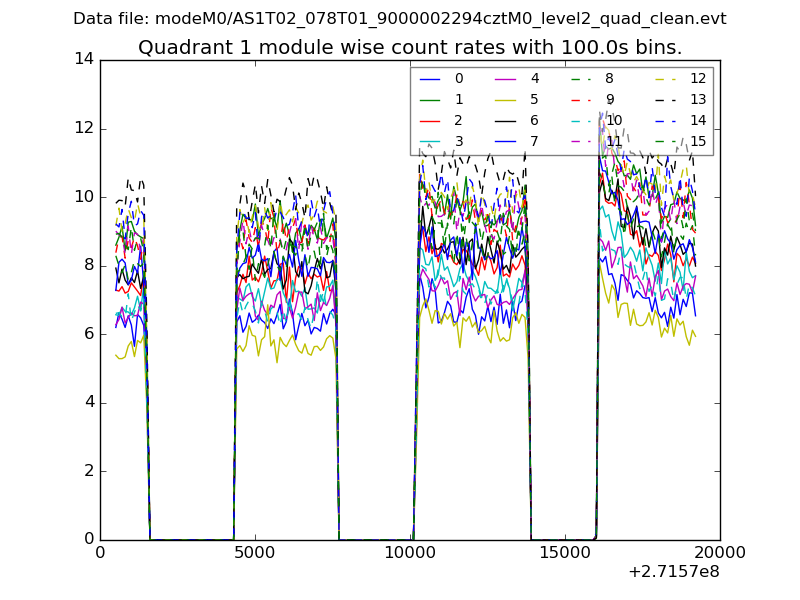
| Module-wise count rates for Quadrant A Data is divided into 100 sec bins |
 |
 |
| Module-wise count rates for Quadrant B Data is divided into 100 sec bins |
 |
 |
| Module-wise count rates for Quadrant C Data is divided into 100 sec bins |
 |
 |
| Module-wise count rates for Quadrant D Data is divided into 100 sec bins |
 |
 |
| Parameter | Plot |
|---|---|
| CZT HV Monitor |  |
| D_VDD |  |
| Temperature 1 |  |
| Veto HV Monitor |  |
| Veto LLD |  |
| Alpha Counter |  |
| _CPM_Rate |  |
| CZT Counter | 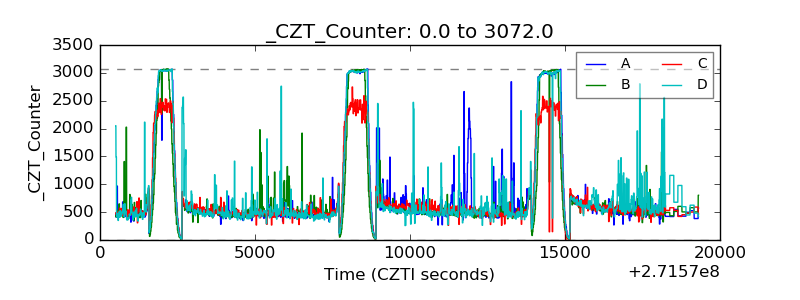 |
| +2.5 Volts monitor |  |
| +5 Volts monitor |  |
| _ROLL_ROT | 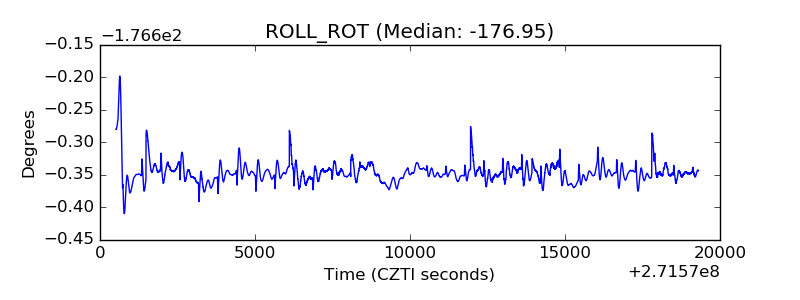 |
| _Roll_DEC |  |
| _Roll_RA |  |
| Veto Counter |  |