| Param | Original file | Final file |
|---|---|---|
| Filename | modeM0/AS1G08_039T01_9000002292cztM0_level2_bc.evt | modeM0/AS1G08_039T01_9000002292cztM0_level2_quad_clean.evt |
| Size (bytes) | 874,854,720 | 280,002,240 |
| Size | 834.3 MB | 267.0 MB |
| Events in quadrant A | 6,210,527 | 1,718,001 |
| Events in quadrant B | 5,888,627 | 1,753,399 |
| Events in quadrant C | 5,759,440 | 1,685,220 |
| Events in quadrant D | 6,972,470 | 1,648,997 |
| Mode M9 | |||
|---|---|---|---|
| Quadrant | BADHDUFLAG | Total packets | Discarded packets |
| A | 0 | 26 | 0 |
| B | 0 | 26 | 0 |
| C | 0 | 26 | 0 |
| D | 0 | 26 | 0 |
| Mode M0 | |||
|---|---|---|---|
| Quadrant | BADHDUFLAG | Total packets | Discarded packets |
| A | 0 | 55604 | 0 |
| B | 0 | 53363 | 0 |
| C | 0 | 52698 | 0 |
| D | 0 | 56504 | 0 |
| Mode SS | |||
|---|---|---|---|
| Quadrant | BADHDUFLAG | Total packets | Discarded packets |
| A | 0 | 496 | 0 |
| B | 0 | 496 | 0 |
| C | 0 | 496 | 0 |
| D | 0 | 496 | 0 |
| Quadrant | Total seconds | Saturated seconds | Saturation percentage |
|---|---|---|---|
| A | 24338 | 517 | 2.124250% |
| B | 24338 | 296 | 1.216205% |
| C | 24338 | 160 | 0.657408% |
| D | 24338 | 377 | 1.549018% |
Noise dominated data is calculated using 1-second bins in cleaned event files. If a bin has >2000 counts, and if more than 50% of those come from <1% of pixels, then it is considered to be noise-dominated and hence unusable.
| Quadrant | # 1 sec bins | Bins with >0 counts | Bins with >2000 counts | High rate bins dominated by noise | Noise dominated (total time) | Noise dominated (detector-on time) | Marked lightcurve |
|---|---|---|---|---|---|---|---|
| A | 26934 | 24339 | 23 | 23 | 0.09% | 0.09% |  |
| B | 26934 | 24339 | 12 | 12 | 0.04% | 0.05% | 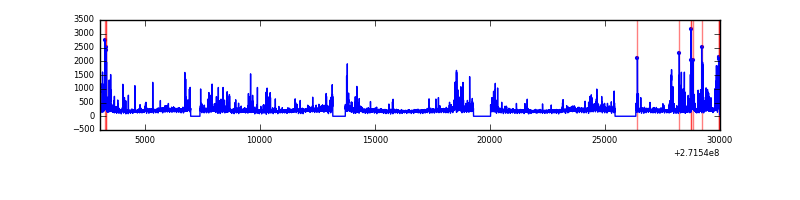 |
| C | 26934 | 24339 | 0 | 0 | 0.00% | 0.00% |  |
| D | 26934 | 24339 | 66 | 66 | 0.25% | 0.27% |  |
Top three noisy pixels from each quadrant. If the there are fewer than three noisy pixels in the level2.evt file, extra rows are filled as -1
| Pixel properties | Quadrant properties | ||||||
|---|---|---|---|---|---|---|---|
| Quadrant | DetID | PixID | Counts | Sigma | Mean | Median | Sigma |
| A | 14 | 237 | 715518 | 2691.79 | 1206 | 1181 | 265.4 |
| A | 14 | 238 | 634245 | 2385.53 | 1206 | 1181 | 265.4 |
| A | 4 | 2 | 112491 | 419.44 | 1206 | 1181 | 265.4 |
| B | 10 | 245 | 610207 | 2604.36 | 1221 | 1190 | 233.8 |
| B | 4 | 142 | 160174 | 679.87 | 1221 | 1190 | 233.8 |
| B | 0 | 189 | 111582 | 472.07 | 1221 | 1190 | 233.8 |
| C | 3 | 233 | 1192073 | 4322.2 | 1163 | 1151 | 275.5 |
| C | 9 | 54 | 36111 | 126.88 | 1163 | 1151 | 275.5 |
| C | 10 | 22 | 17030 | 57.63 | 1163 | 1151 | 275.5 |
| D | 5 | 222 | 926320 | 3313.53 | 1184 | 1139 | 279.2 |
| D | 1 | 52 | 512555 | 1831.63 | 1184 | 1139 | 279.2 |
| D | 10 | 70 | 318003 | 1134.85 | 1184 | 1139 | 279.2 |
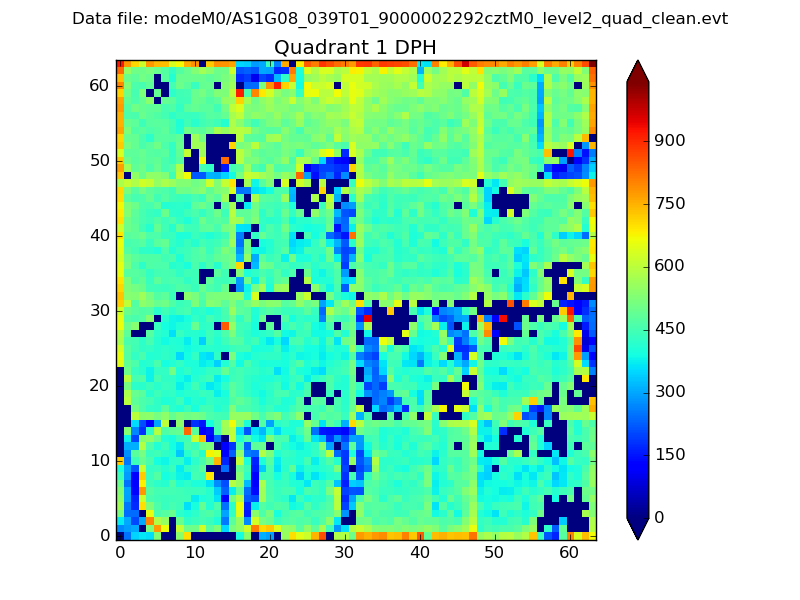
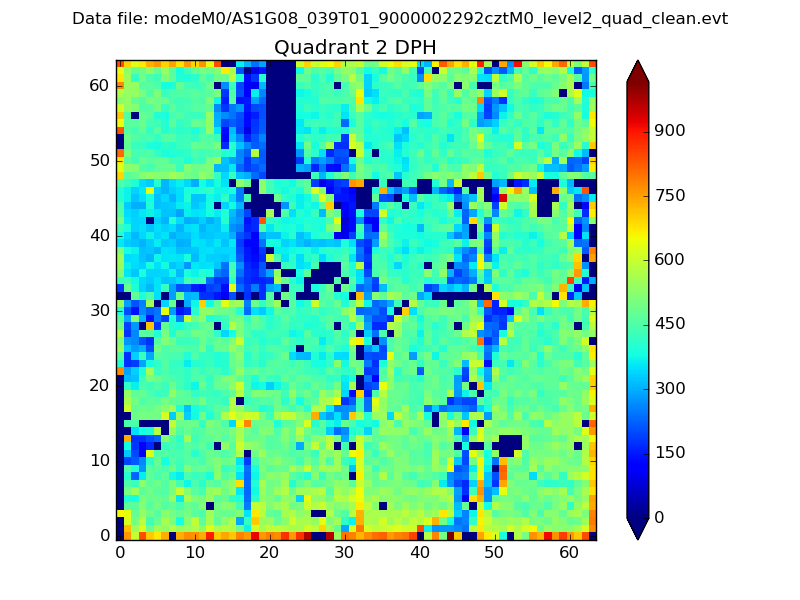
Histogram calculated using DETX and DETY for each event in the final _common_clean file
| Quadrant A |  |
 |
Quadrant B |
|---|---|---|---|
| Quadrant D |  |
 |
Quadrant C |
| Plot type | Count rate plots | Images |
|---|---|---|
| Comparison with Poisson distribution Blue bars denote a histogram of data divided into 1 sec bins. Red curve is a Poisson curve with rate = median count rate of data. |
 |
 |
| Quadrant-wise count rates Data is divided into 100 sec bins |
 |
|
| Module-wise count rates for Quadrant A Data is divided into 100 sec bins |
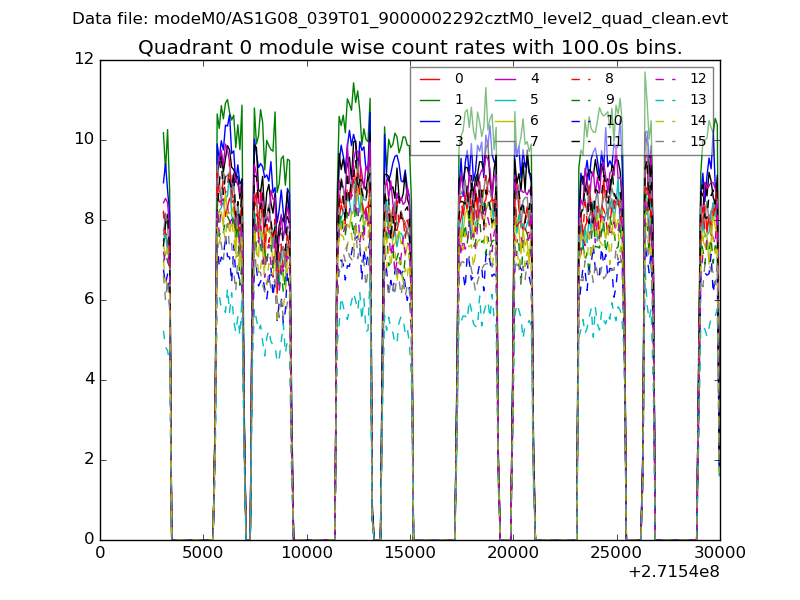 |
 |
| Module-wise count rates for Quadrant B Data is divided into 100 sec bins |
 |
 |
| Module-wise count rates for Quadrant C Data is divided into 100 sec bins |
 |
 |
| Module-wise count rates for Quadrant D Data is divided into 100 sec bins |
 |
 |
| Parameter | Plot |
|---|---|
| CZT HV Monitor | 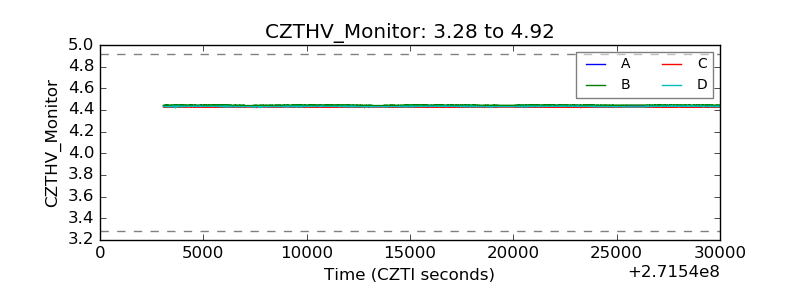 |
| D_VDD |  |
| Temperature 1 |  |
| Veto HV Monitor |  |
| Veto LLD |  |
| Alpha Counter |  |
| _CPM_Rate | 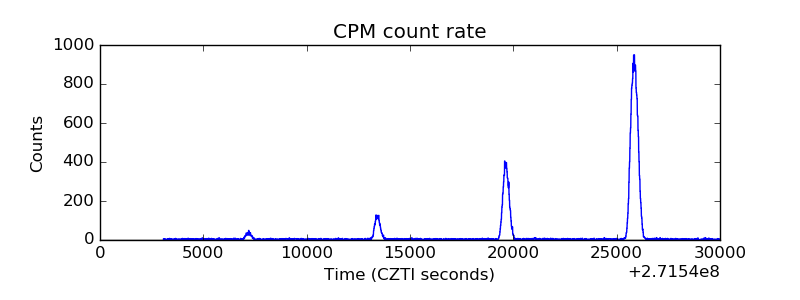 |
| CZT Counter |  |
| +2.5 Volts monitor | 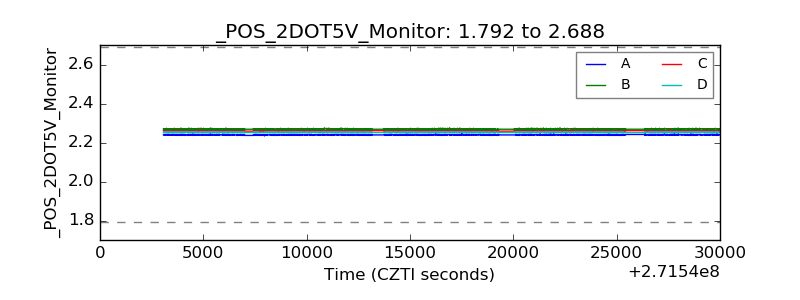 |
| +5 Volts monitor |  |
| _ROLL_ROT |  |
| _Roll_DEC |  |
| _Roll_RA |  |
| Veto Counter |  |