| Param | Original file | Final file |
|---|---|---|
| Filename | modeM0/AS1G08_036T01_9000002290cztM0_level2_bc.evt | modeM0/AS1G08_036T01_9000002290cztM0_level2_quad_clean.evt |
| Size (bytes) | 720,348,480 | 260,441,280 |
| Size | 687.0 MB | 248.4 MB |
| Events in quadrant A | 4,292,687 | 1,659,471 |
| Events in quadrant B | 4,918,028 | 1,674,354 |
| Events in quadrant C | 4,310,247 | 1,616,634 |
| Events in quadrant D | 6,931,963 | 1,566,750 |
| Mode M9 | |||
|---|---|---|---|
| Quadrant | BADHDUFLAG | Total packets | Discarded packets |
| A | 0 | 26 | 0 |
| B | 0 | 26 | 0 |
| C | 0 | 26 | 0 |
| D | 0 | 26 | 0 |
| Mode M0 | |||
|---|---|---|---|
| Quadrant | BADHDUFLAG | Total packets | Discarded packets |
| A | 0 | 42247 | 0 |
| B | 0 | 44175 | 0 |
| C | 0 | 42265 | 0 |
| D | 0 | 51516 | 0 |
| Mode SS | |||
|---|---|---|---|
| Quadrant | BADHDUFLAG | Total packets | Discarded packets |
| A | 0 | 404 | 0 |
| B | 0 | 404 | 0 |
| C | 0 | 404 | 0 |
| D | 0 | 404 | 0 |
| Quadrant | Total seconds | Saturated seconds | Saturation percentage |
|---|---|---|---|
| A | 19907 | 320 | 1.607475% |
| B | 19907 | 374 | 1.878736% |
| C | 19907 | 324 | 1.627568% |
| D | 19907 | 772 | 3.878033% |
Noise dominated data is calculated using 1-second bins in cleaned event files. If a bin has >2000 counts, and if more than 50% of those come from <1% of pixels, then it is considered to be noise-dominated and hence unusable.
| Quadrant | # 1 sec bins | Bins with >0 counts | Bins with >2000 counts | High rate bins dominated by noise | Noise dominated (total time) | Noise dominated (detector-on time) | Marked lightcurve |
|---|---|---|---|---|---|---|---|
| A | 22493 | 19909 | 6 | 6 | 0.03% | 0.03% |  |
| B | 22493 | 19910 | 17 | 17 | 0.08% | 0.09% |  |
| C | 22493 | 19909 | 0 | 0 | 0.00% | 0.00% |  |
| D | 22493 | 19909 | 99 | 99 | 0.44% | 0.50% |  |
Top three noisy pixels from each quadrant. If the there are fewer than three noisy pixels in the level2.evt file, extra rows are filled as -1
| Pixel properties | Quadrant properties | ||||||
|---|---|---|---|---|---|---|---|
| Quadrant | DetID | PixID | Counts | Sigma | Mean | Median | Sigma |
| A | 15 | 69 | 84912 | 366.08 | 1038 | 1016 | 229.2 |
| A | 0 | 253 | 80096 | 345.06 | 1038 | 1016 | 229.2 |
| A | 9 | 143 | 60361 | 258.95 | 1038 | 1016 | 229.2 |
| B | 10 | 245 | 254957 | 1262.6 | 1043 | 1016 | 201.1 |
| B | 4 | 142 | 216711 | 1072.44 | 1043 | 1016 | 201.1 |
| B | 0 | 189 | 87372 | 429.36 | 1043 | 1016 | 201.1 |
| C | 3 | 233 | 382093 | 1628.3 | 994 | 987 | 234.1 |
| C | 9 | 54 | 80374 | 339.18 | 994 | 987 | 234.1 |
| C | 0 | 207 | 12400 | 48.76 | 994 | 987 | 234.1 |
| D | 1 | 52 | 1847059 | 7825.11 | 1004 | 965 | 235.9 |
| D | 5 | 222 | 609766 | 2580.55 | 1004 | 965 | 235.9 |
| D | 10 | 70 | 130390 | 548.6 | 1004 | 965 | 235.9 |
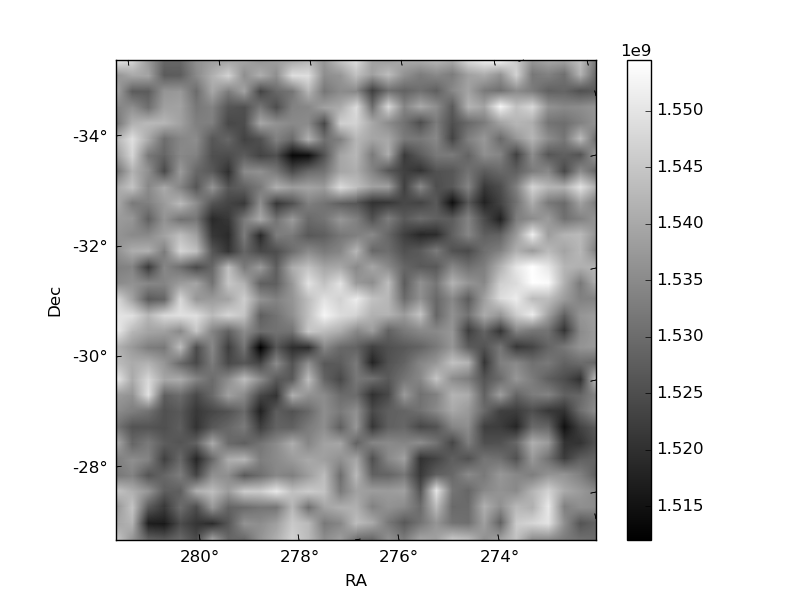
Histogram calculated using DETX and DETY for each event in the final _common_clean file
| Quadrant A |  |
 |
Quadrant B |
|---|---|---|---|
| Quadrant D |  |
 |
Quadrant C |
| Plot type | Count rate plots | Images |
|---|---|---|
| Comparison with Poisson distribution Blue bars denote a histogram of data divided into 1 sec bins. Red curve is a Poisson curve with rate = median count rate of data. |
 |
 |
| Quadrant-wise count rates Data is divided into 100 sec bins |
 |
|
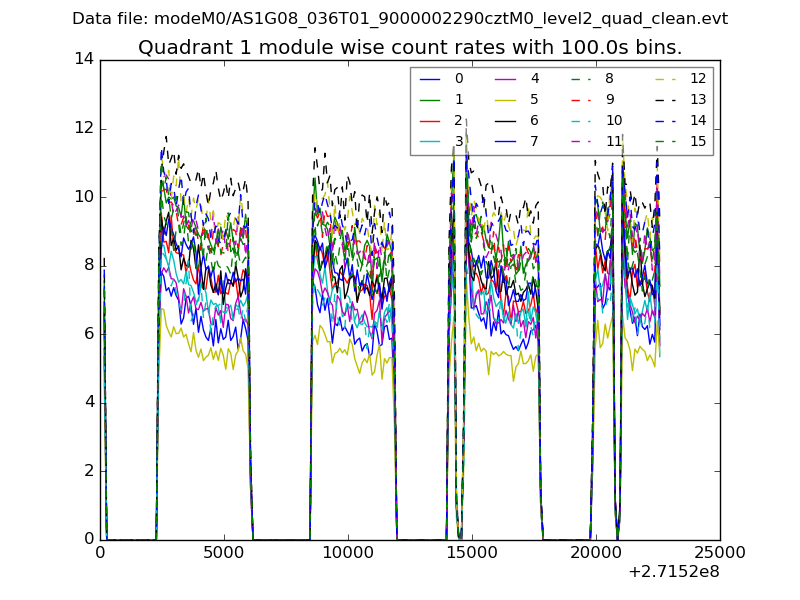
| Module-wise count rates for Quadrant A Data is divided into 100 sec bins |
 |
 |
| Module-wise count rates for Quadrant B Data is divided into 100 sec bins |
 |
 |
| Module-wise count rates for Quadrant C Data is divided into 100 sec bins |
 |
 |
| Module-wise count rates for Quadrant D Data is divided into 100 sec bins |
 |
 |
| Parameter | Plot |
|---|---|
| CZT HV Monitor |  |
| D_VDD |  |
| Temperature 1 | 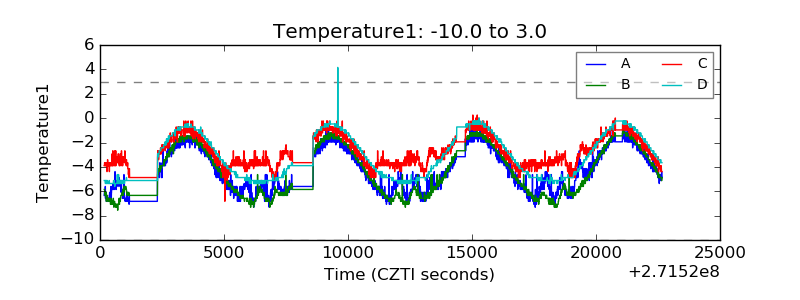 |
| Veto HV Monitor | 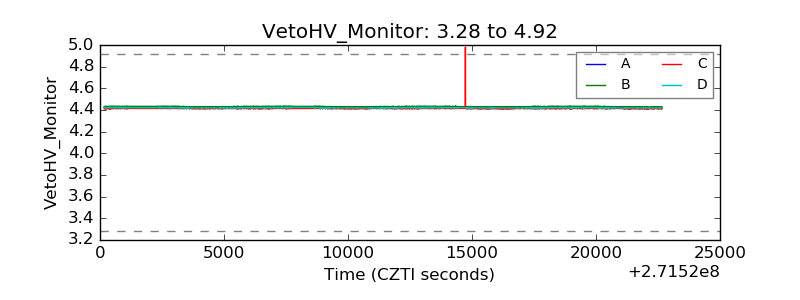 |
| Veto LLD | 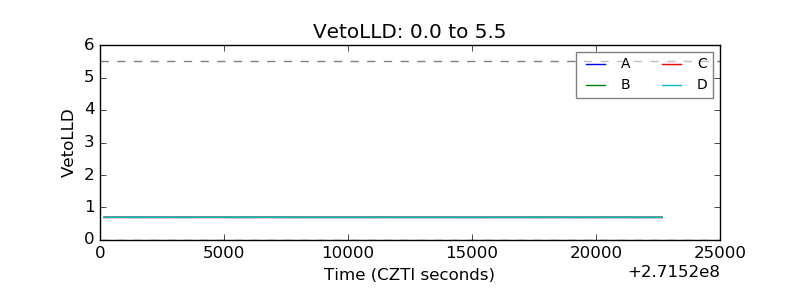 |
| Alpha Counter |  |
| _CPM_Rate |  |
| CZT Counter | 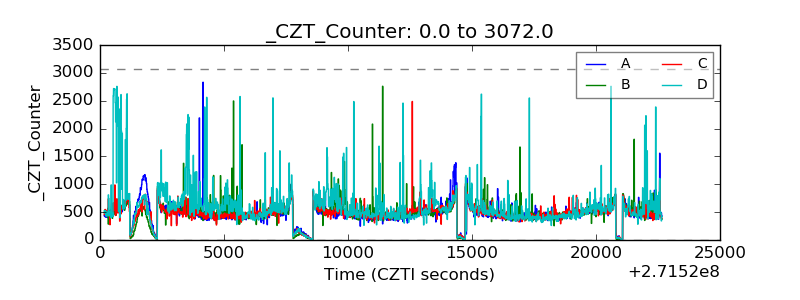 |
| +2.5 Volts monitor |  |
| +5 Volts monitor | 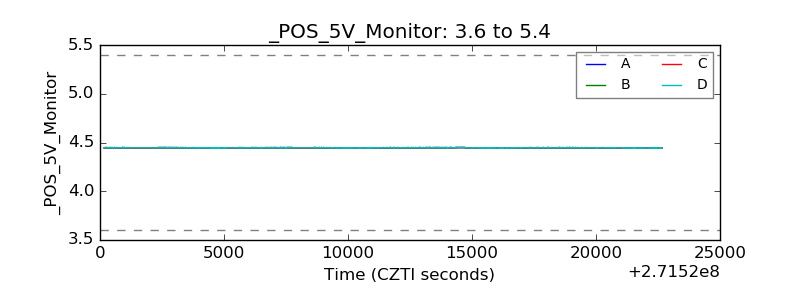 |
| _ROLL_ROT |  |
| _Roll_DEC |  |
| _Roll_RA | 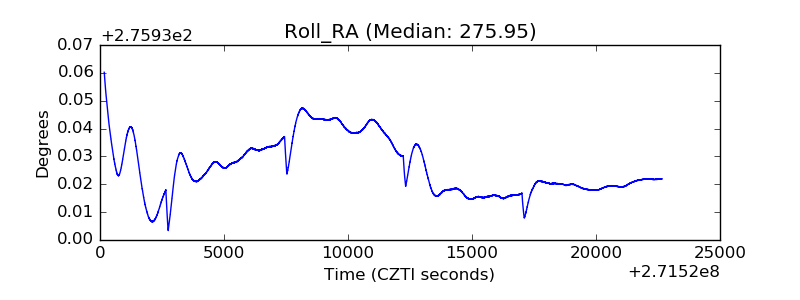 |
| Veto Counter |  |