| Param | Original file | Final file |
|---|---|---|
| Filename | modeM0/AS1T02_082T01_9000002286cztM0_level2_bc.evt | modeM0/AS1T02_082T01_9000002286cztM0_level2_quad_clean.evt |
| Size (bytes) | 1,584,835,200 | 558,979,200 |
| Size | 1.5 GB | 533.1 MB |
| Events in quadrant A | 10,900,242 | 3,533,112 |
| Events in quadrant B | 11,447,198 | 3,547,482 |
| Events in quadrant C | 9,822,586 | 3,464,869 |
| Events in quadrant D | 12,827,619 | 3,367,416 |
| Mode SS | |||
|---|---|---|---|
| Quadrant | BADHDUFLAG | Total packets | Discarded packets |
| A | 0 | 892 | 0 |
| B | 0 | 892 | 0 |
| C | 0 | 892 | 0 |
| D | 0 | 892 | 0 |
| Mode M0 | |||
|---|---|---|---|
| Quadrant | BADHDUFLAG | Total packets | Discarded packets |
| A | 0 | 97347 | 0 |
| B | 0 | 99572 | 0 |
| C | 0 | 94144 | 0 |
| D | 0 | 102607 | 0 |
| Mode M9 | |||
|---|---|---|---|
| Quadrant | BADHDUFLAG | Total packets | Discarded packets |
| A | 0 | 52 | 0 |
| B | 0 | 52 | 0 |
| C | 0 | 52 | 0 |
| D | 0 | 52 | 0 |
| Quadrant | Total seconds | Saturated seconds | Saturation percentage |
|---|---|---|---|
| A | 43974 | 901 | 2.048938% |
| B | 43974 | 1035 | 2.353664% |
| C | 43974 | 575 | 1.307591% |
| D | 43974 | 853 | 1.939783% |
Noise dominated data is calculated using 1-second bins in cleaned event files. If a bin has >2000 counts, and if more than 50% of those come from <1% of pixels, then it is considered to be noise-dominated and hence unusable.
| Quadrant | # 1 sec bins | Bins with >0 counts | Bins with >2000 counts | High rate bins dominated by noise | Noise dominated (total time) | Noise dominated (detector-on time) | Marked lightcurve |
|---|---|---|---|---|---|---|---|
| A | 48980 | 43977 | 191 | 191 | 0.39% | 0.43% |  |
| B | 48980 | 43975 | 100 | 100 | 0.20% | 0.23% |  |
| C | 48980 | 43974 | 0 | 0 | 0.00% | 0.00% |  |
| D | 48980 | 43976 | 128 | 128 | 0.26% | 0.29% |  |
Top three noisy pixels from each quadrant. If the there are fewer than three noisy pixels in the level2.evt file, extra rows are filled as -1
| Pixel properties | Quadrant properties | ||||||
|---|---|---|---|---|---|---|---|
| Quadrant | DetID | PixID | Counts | Sigma | Mean | Median | Sigma |
| A | 14 | 238 | 2077599 | 4306.67 | 2208 | 2167 | 481.9 |
| A | 9 | 143 | 105152 | 213.7 | 2208 | 2167 | 481.9 |
| A | 14 | 237 | 80020 | 161.55 | 2208 | 2167 | 481.9 |
| B | 10 | 245 | 1465197 | 3452.94 | 2223 | 2165 | 423.7 |
| B | 3 | 209 | 190164 | 443.7 | 2223 | 2165 | 423.7 |
| B | 0 | 197 | 189573 | 442.31 | 2223 | 2165 | 423.7 |
| C | 3 | 233 | 1534894 | 3068.62 | 2130 | 2118 | 499.5 |
| C | 10 | 22 | 26069 | 47.95 | 2130 | 2118 | 499.5 |
| C | 13 | 61 | 12854 | 21.49 | 2130 | 2118 | 499.5 |
| D | 1 | 52 | 1816539 | 3635.0 | 2169 | 2094 | 499.2 |
| D | 2 | 33 | 617056 | 1231.99 | 2169 | 2094 | 499.2 |
| D | 5 | 222 | 592267 | 1182.33 | 2169 | 2094 | 499.2 |
Histogram calculated using DETX and DETY for each event in the final _common_clean file
| Quadrant A | 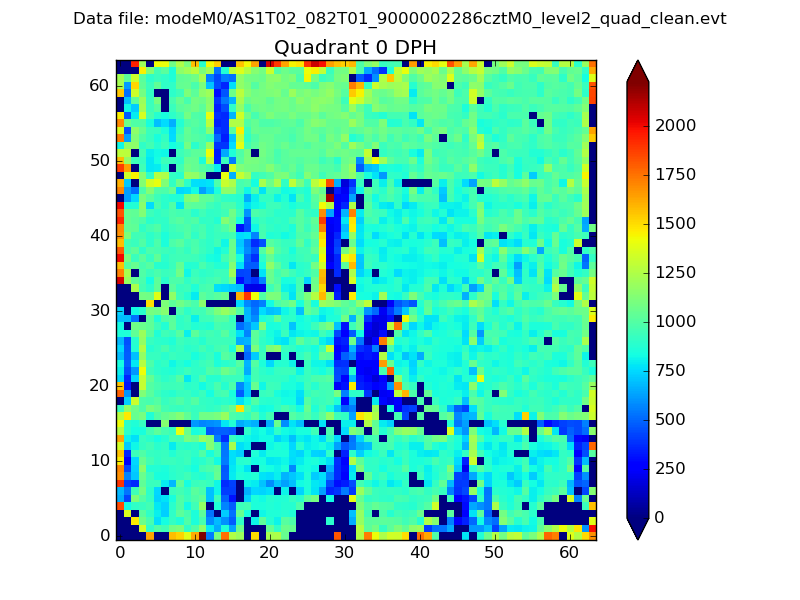 |
 |
Quadrant B |
|---|---|---|---|
| Quadrant D |  |
 |
Quadrant C |
| Plot type | Count rate plots | Images |
|---|---|---|
| Comparison with Poisson distribution Blue bars denote a histogram of data divided into 1 sec bins. Red curve is a Poisson curve with rate = median count rate of data. |
 |
 |
| Quadrant-wise count rates Data is divided into 100 sec bins |
 |
|
| Module-wise count rates for Quadrant A Data is divided into 100 sec bins |
 |
 |
| Module-wise count rates for Quadrant B Data is divided into 100 sec bins |
 |
 |
| Module-wise count rates for Quadrant C Data is divided into 100 sec bins |
 |
 |
| Module-wise count rates for Quadrant D Data is divided into 100 sec bins |
 |
 |
| Parameter | Plot |
|---|---|
| CZT HV Monitor |  |
| D_VDD | 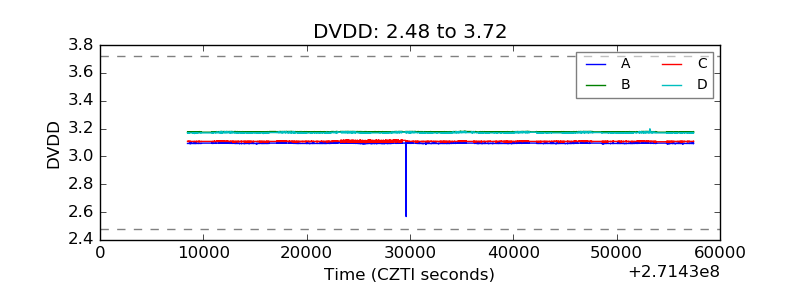 |
| Temperature 1 | 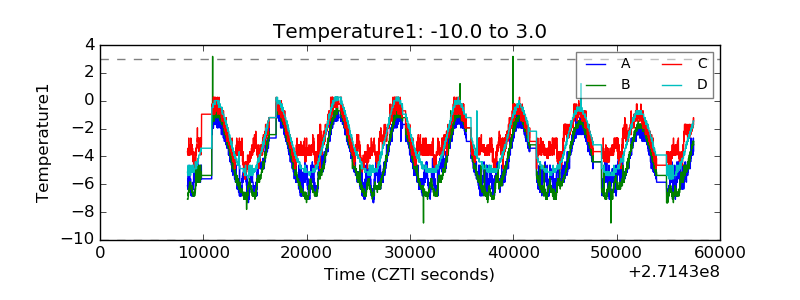 |
| Veto HV Monitor |  |
| Veto LLD |  |
| Alpha Counter |  |
| _CPM_Rate |  |
| CZT Counter |  |
| +2.5 Volts monitor |  |
| +5 Volts monitor |  |
| _ROLL_ROT |  |
| _Roll_DEC |  |
| _Roll_RA |  |
| Veto Counter | 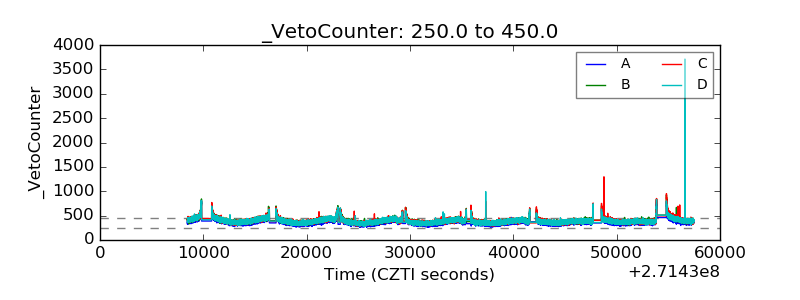 |