| Param | Original file | Final file |
|---|---|---|
| Filename | modeM0/AS1T02_077T01_9000002282cztM0_level2_bc.evt | modeM0/AS1T02_077T01_9000002282cztM0_level2_quad_clean.evt |
| Size (bytes) | 531,239,040 | 235,391,040 |
| Size | 506.6 MB | 224.5 MB |
| Events in quadrant A | 3,809,383 | 1,556,179 |
| Events in quadrant B | 3,594,549 | 1,576,959 |
| Events in quadrant C | 3,472,439 | 1,567,385 |
| Events in quadrant D | 4,281,349 | 1,492,162 |
| Mode M9 | |||
|---|---|---|---|
| Quadrant | BADHDUFLAG | Total packets | Discarded packets |
| A | 0 | 34 | 0 |
| B | 0 | 34 | 0 |
| C | 0 | 34 | 0 |
| D | 0 | 34 | 0 |
| Mode SS | |||
|---|---|---|---|
| Quadrant | BADHDUFLAG | Total packets | Discarded packets |
| A | 0 | 276 | 0 |
| B | 0 | 276 | 0 |
| C | 0 | 276 | 0 |
| D | 0 | 276 | 0 |
| Mode M0 | |||
|---|---|---|---|
| Quadrant | BADHDUFLAG | Total packets | Discarded packets |
| A | 0 | 32225 | 0 |
| B | 0 | 30384 | 0 |
| C | 0 | 29464 | 0 |
| D | 0 | 32116 | 0 |
| Quadrant | Total seconds | Saturated seconds | Saturation percentage |
|---|---|---|---|
| A | 13571 | 287 | 2.114804% |
| B | 13571 | 169 | 1.245302% |
| C | 13571 | 105 | 0.773709% |
| D | 13571 | 233 | 1.716896% |
Noise dominated data is calculated using 1-second bins in cleaned event files. If a bin has >2000 counts, and if more than 50% of those come from <1% of pixels, then it is considered to be noise-dominated and hence unusable.
| Quadrant | # 1 sec bins | Bins with >0 counts | Bins with >2000 counts | High rate bins dominated by noise | Noise dominated (total time) | Noise dominated (detector-on time) | Marked lightcurve |
|---|---|---|---|---|---|---|---|
| A | 16086 | 13570 | 7 | 7 | 0.04% | 0.05% | 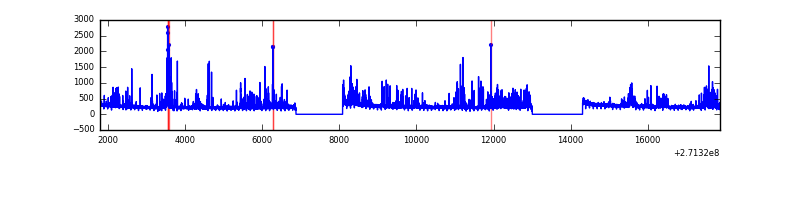 |
| B | 16086 | 13570 | 4 | 4 | 0.02% | 0.03% |  |
| C | 16086 | 13570 | 0 | 0 | 0.00% | 0.00% |  |
| D | 16086 | 13571 | 31 | 31 | 0.19% | 0.23% | 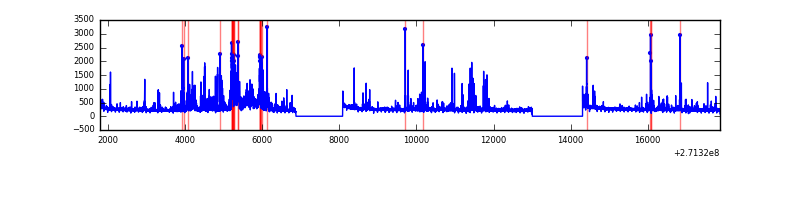 |
Top three noisy pixels from each quadrant. If the there are fewer than three noisy pixels in the level2.evt file, extra rows are filled as -1
| Pixel properties | Quadrant properties | ||||||
|---|---|---|---|---|---|---|---|
| Quadrant | DetID | PixID | Counts | Sigma | Mean | Median | Sigma |
| A | 14 | 238 | 405098 | 2360.01 | 806 | 794 | 171.3 |
| A | 9 | 143 | 118810 | 688.89 | 806 | 794 | 171.3 |
| A | 14 | 237 | 115363 | 668.76 | 806 | 794 | 171.3 |
| B | 4 | 142 | 168490 | 1122.41 | 810 | 795 | 149.4 |
| B | 0 | 189 | 58819 | 388.36 | 810 | 795 | 149.4 |
| B | 0 | 197 | 53245 | 351.06 | 810 | 795 | 149.4 |
| C | 3 | 233 | 375732 | 2185.11 | 787 | 784 | 171.6 |
| C | 10 | 22 | 11286 | 61.2 | 787 | 784 | 171.6 |
| C | 0 | 207 | 6181 | 31.45 | 787 | 784 | 171.6 |
| D | 5 | 222 | 613143 | 3407.16 | 794 | 773 | 179.7 |
| D | 1 | 52 | 289230 | 1604.94 | 794 | 773 | 179.7 |
| D | 7 | 38 | 84528 | 466.0 | 794 | 773 | 179.7 |
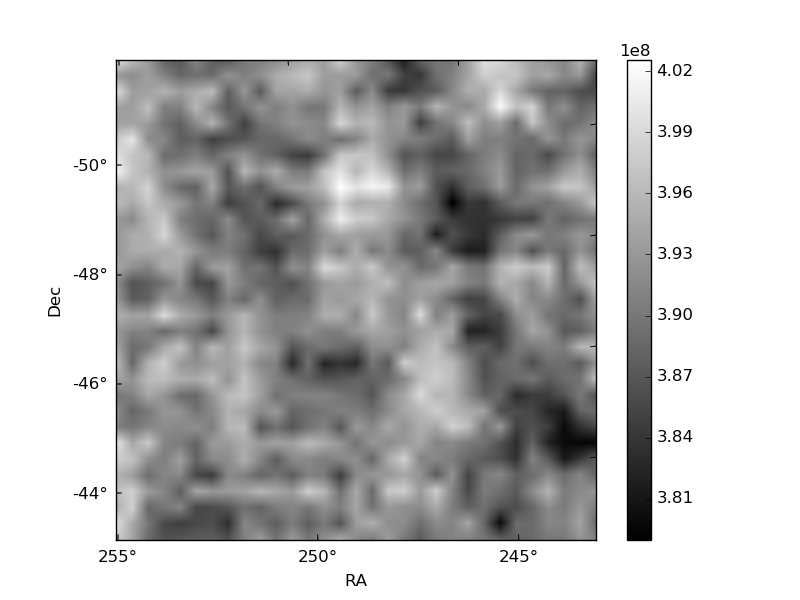
Histogram calculated using DETX and DETY for each event in the final _common_clean file
| Quadrant A |  |
 |
Quadrant B |
|---|---|---|---|
| Quadrant D |  |
 |
Quadrant C |
| Plot type | Count rate plots | Images |
|---|---|---|
| Comparison with Poisson distribution Blue bars denote a histogram of data divided into 1 sec bins. Red curve is a Poisson curve with rate = median count rate of data. |
 |
 |
| Quadrant-wise count rates Data is divided into 100 sec bins |
 |
|
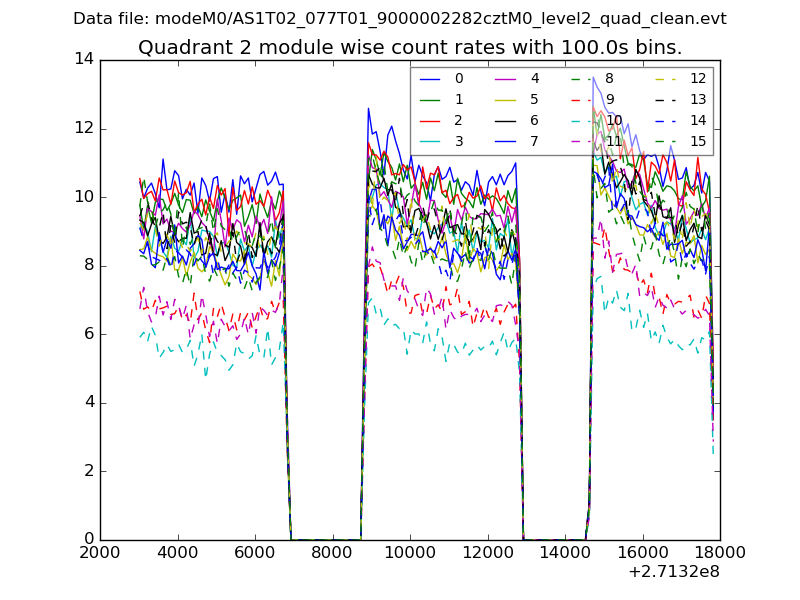
| Module-wise count rates for Quadrant A Data is divided into 100 sec bins |
 |
 |
| Module-wise count rates for Quadrant B Data is divided into 100 sec bins |
 |
 |
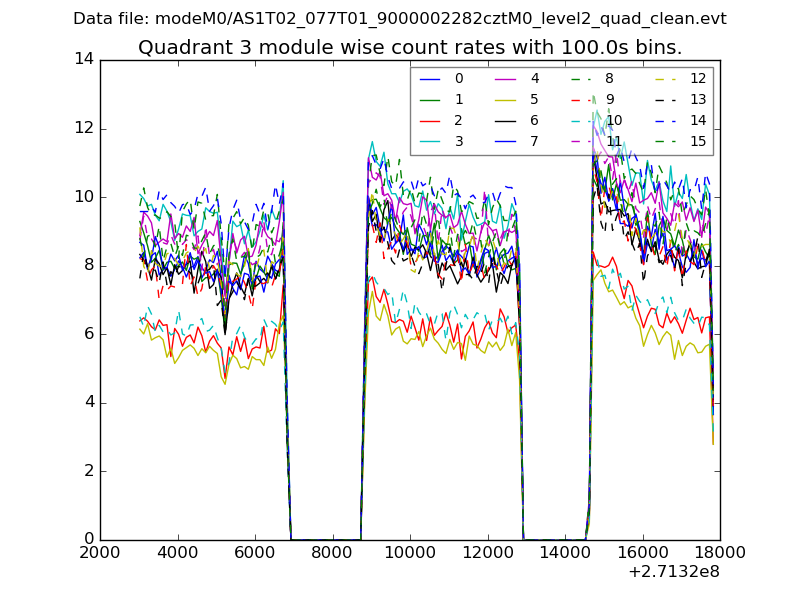
| Module-wise count rates for Quadrant C Data is divided into 100 sec bins |
 |
 |
| Module-wise count rates for Quadrant D Data is divided into 100 sec bins |
 |
 |
| Parameter | Plot |
|---|---|
| CZT HV Monitor |  |
| D_VDD |  |
| Temperature 1 | 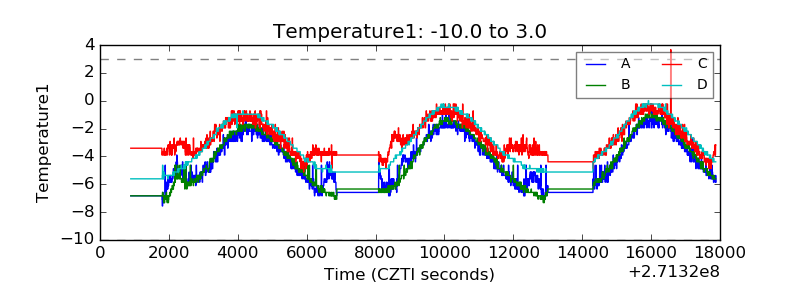 |
| Veto HV Monitor |  |
| Veto LLD |  |
| Alpha Counter |  |
| _CPM_Rate |  |
| CZT Counter | 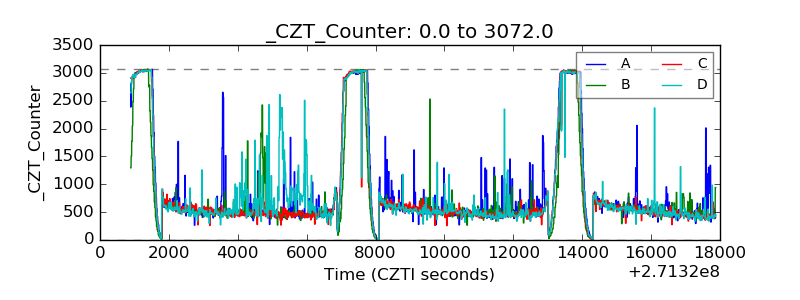 |
| +2.5 Volts monitor | 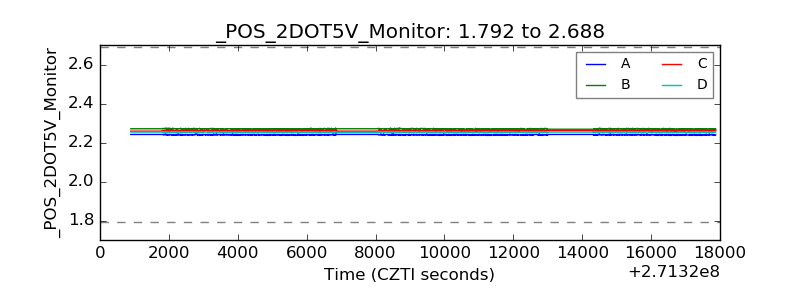 |
| +5 Volts monitor |  |
| _ROLL_ROT |  |
| _Roll_DEC | 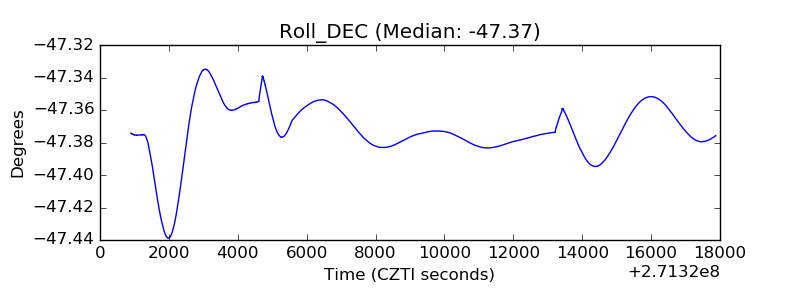 |
| _Roll_RA |  |
| Veto Counter |  |