| Param | Original file | Final file |
|---|---|---|
| Filename | modeM0/AS1G08_033T01_9000002278cztM0_level2_bc.evt | modeM0/AS1G08_033T01_9000002278cztM0_level2_quad_clean.evt |
| Size (bytes) | 760,847,040 | 272,016,000 |
| Size | 725.6 MB | 259.4 MB |
| Events in quadrant A | 4,779,473 | 1,778,618 |
| Events in quadrant B | 4,424,759 | 1,805,960 |
| Events in quadrant C | 4,619,358 | 1,777,371 |
| Events in quadrant D | 7,998,194 | 1,647,722 |
| Mode M0 | |||
|---|---|---|---|
| Quadrant | BADHDUFLAG | Total packets | Discarded packets |
| A | 0 | 41753 | 0 |
| B | 0 | 39415 | 0 |
| C | 0 | 38861 | 0 |
| D | 0 | 50188 | 0 |
| Mode SS | |||
|---|---|---|---|
| Quadrant | BADHDUFLAG | Total packets | Discarded packets |
| A | 0 | 364 | 0 |
| B | 0 | 364 | 0 |
| C | 0 | 364 | 0 |
| D | 0 | 364 | 0 |
| Mode M9 | |||
|---|---|---|---|
| Quadrant | BADHDUFLAG | Total packets | Discarded packets |
| A | 0 | 43 | 0 |
| B | 0 | 43 | 0 |
| C | 0 | 43 | 0 |
| D | 0 | 43 | 0 |
| Quadrant | Total seconds | Saturated seconds | Saturation percentage |
|---|---|---|---|
| A | 17835 | 560 | 3.139893% |
| B | 17835 | 313 | 1.754976% |
| C | 17835 | 160 | 0.897112% |
| D | 17835 | 1480 | 8.298290% |
Noise dominated data is calculated using 1-second bins in cleaned event files. If a bin has >2000 counts, and if more than 50% of those come from <1% of pixels, then it is considered to be noise-dominated and hence unusable.
| Quadrant | # 1 sec bins | Bins with >0 counts | Bins with >2000 counts | High rate bins dominated by noise | Noise dominated (total time) | Noise dominated (detector-on time) | Marked lightcurve |
|---|---|---|---|---|---|---|---|
| A | 22061 | 17837 | 17 | 17 | 0.08% | 0.10% |  |
| B | 22061 | 17836 | 6 | 6 | 0.03% | 0.03% |  |
| C | 22061 | 17836 | 0 | 0 | 0.00% | 0.00% |  |
| D | 22061 | 17836 | 869 | 869 | 3.94% | 4.87% |  |
Top three noisy pixels from each quadrant. If the there are fewer than three noisy pixels in the level2.evt file, extra rows are filled as -1
| Pixel properties | Quadrant properties | ||||||
|---|---|---|---|---|---|---|---|
| Quadrant | DetID | PixID | Counts | Sigma | Mean | Median | Sigma |
| A | 14 | 238 | 469514 | 2225.97 | 961 | 945 | 210.5 |
| A | 4 | 2 | 190610 | 901.01 | 961 | 945 | 210.5 |
| A | 13 | 248 | 152222 | 718.65 | 961 | 945 | 210.5 |
| B | 4 | 142 | 142114 | 759.49 | 972 | 950 | 185.9 |
| B | 10 | 245 | 94096 | 501.15 | 972 | 950 | 185.9 |
| B | 0 | 189 | 81528 | 433.53 | 972 | 950 | 185.9 |
| C | 3 | 233 | 933561 | 4487.31 | 936 | 926 | 207.8 |
| C | 10 | 22 | 12005 | 53.31 | 936 | 926 | 207.8 |
| C | 7 | 247 | 9588 | 41.68 | 936 | 926 | 207.8 |
| D | 1 | 52 | 3034040 | 14025.51 | 925 | 892 | 216.3 |
| D | 5 | 222 | 454878 | 2099.27 | 925 | 892 | 216.3 |
| D | 2 | 33 | 397712 | 1834.93 | 925 | 892 | 216.3 |
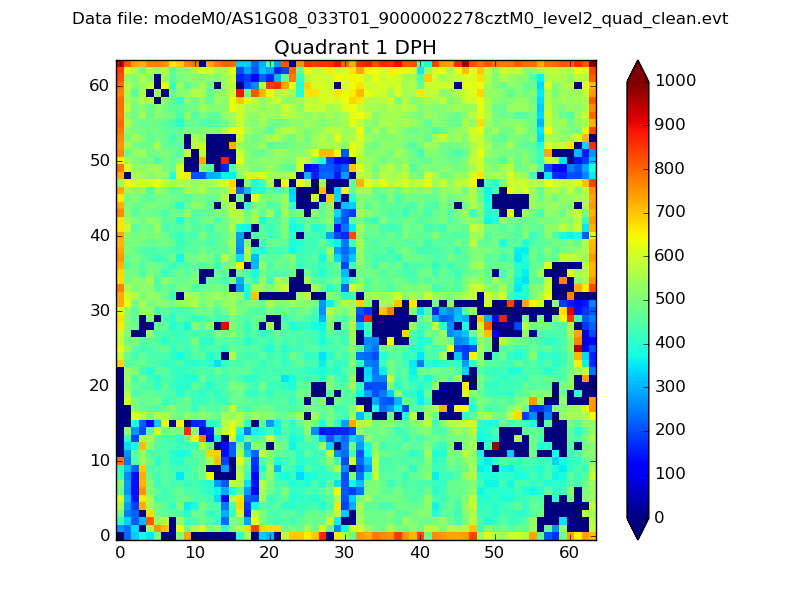
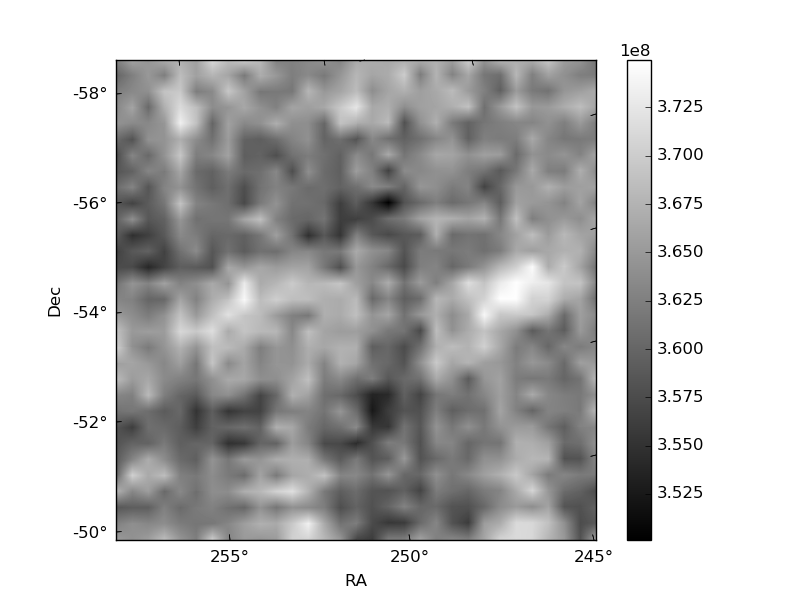
Histogram calculated using DETX and DETY for each event in the final _common_clean file
| Quadrant A |  |
 |
Quadrant B |
|---|---|---|---|
| Quadrant D |  |
 |
Quadrant C |
| Plot type | Count rate plots | Images |
|---|---|---|
| Comparison with Poisson distribution Blue bars denote a histogram of data divided into 1 sec bins. Red curve is a Poisson curve with rate = median count rate of data. |
 |
 |
| Quadrant-wise count rates Data is divided into 100 sec bins |
 |
|
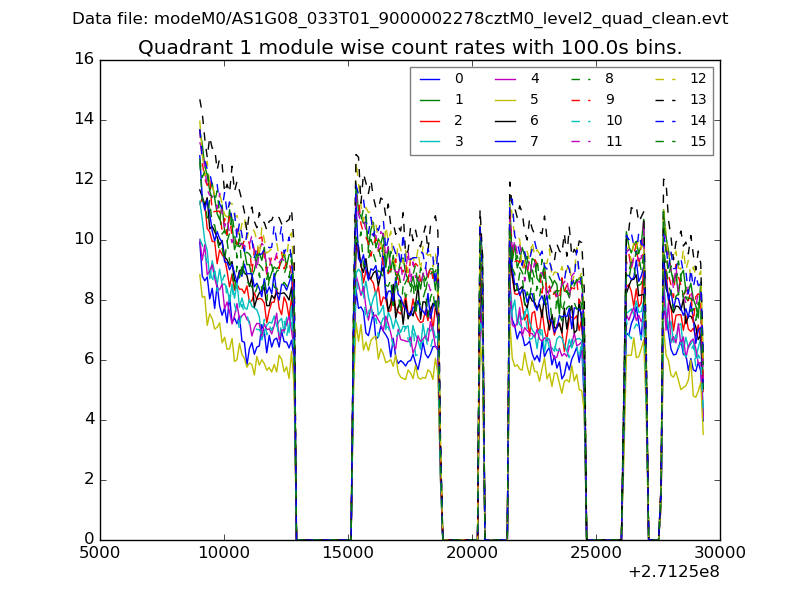
| Module-wise count rates for Quadrant A Data is divided into 100 sec bins |
 |
 |
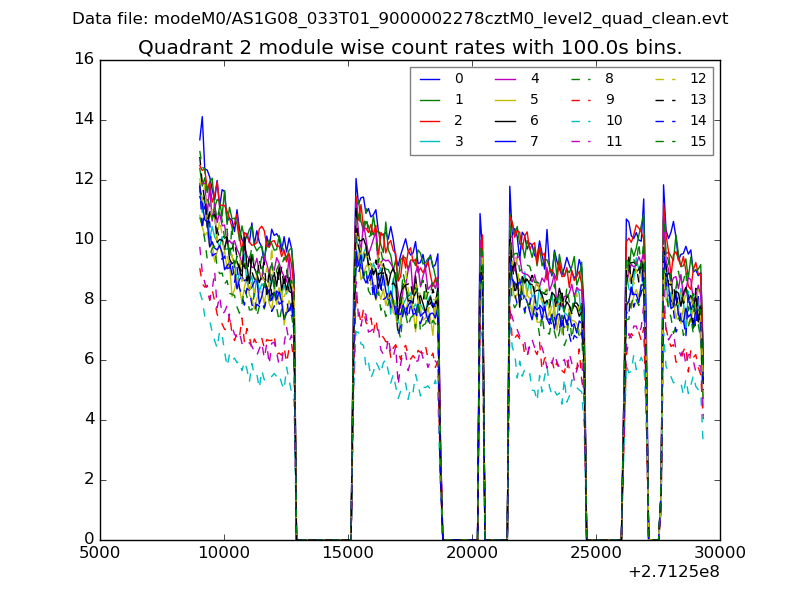
| Module-wise count rates for Quadrant B Data is divided into 100 sec bins |
 |
 |
| Module-wise count rates for Quadrant C Data is divided into 100 sec bins |
 |
 |
| Module-wise count rates for Quadrant D Data is divided into 100 sec bins |
 |
 |
| Parameter | Plot |
|---|---|
| CZT HV Monitor |  |
| D_VDD |  |
| Temperature 1 |  |
| Veto HV Monitor | 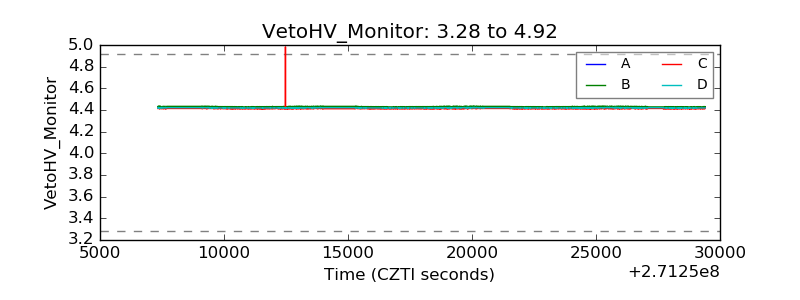 |
| Veto LLD |  |
| Alpha Counter | 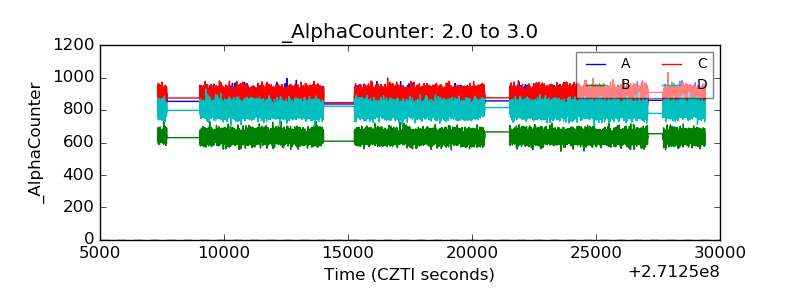 |
| _CPM_Rate | 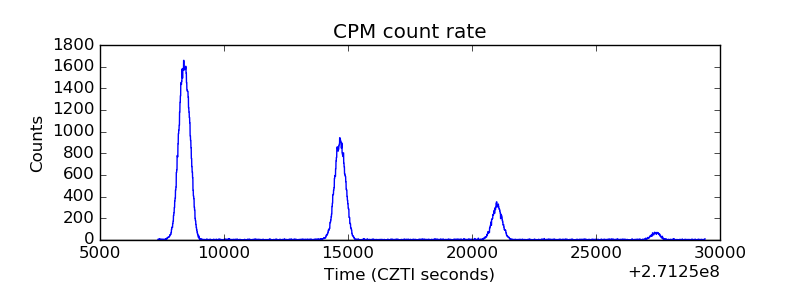 |
| CZT Counter |  |
| +2.5 Volts monitor | 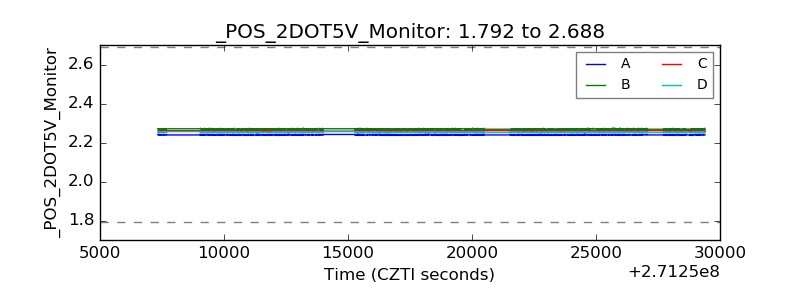 |
| +5 Volts monitor |  |
| _ROLL_ROT |  |
| _Roll_DEC |  |
| _Roll_RA |  |
| Veto Counter | 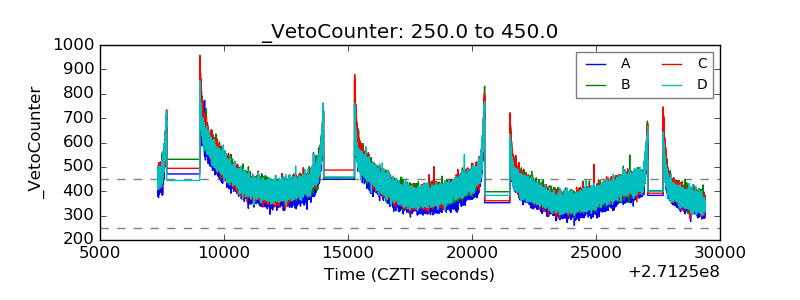 |