| Param | Original file | Final file |
|---|---|---|
| Filename | modeM0/AS1T02_080T01_9000002276cztM0_level2_bc.evt | modeM0/AS1T02_080T01_9000002276cztM0_level2_quad_clean.evt |
| Size (bytes) | 4,121,962,560 | 1,237,792,320 |
| Size | 3.8 GB | 1.2 GB |
| Events in quadrant A | 21,986,960 | 7,972,489 |
| Events in quadrant B | 20,809,013 | 8,118,777 |
| Events in quadrant C | 27,735,971 | 8,032,704 |
| Events in quadrant D | 48,226,724 | 7,242,724 |
| Mode M9 | |||
|---|---|---|---|
| Quadrant | BADHDUFLAG | Total packets | Discarded packets |
| A | 0 | 164 | 0 |
| B | 0 | 164 | 0 |
| C | 0 | 164 | 0 |
| D | 0 | 164 | 0 |
| Mode SS | |||
|---|---|---|---|
| Quadrant | BADHDUFLAG | Total packets | Discarded packets |
| A | 0 | 1818 | 0 |
| B | 0 | 1818 | 0 |
| C | 0 | 1818 | 0 |
| D | 0 | 1818 | 0 |
| Mode M0 | |||
|---|---|---|---|
| Quadrant | BADHDUFLAG | Total packets | Discarded packets |
| A | 0 | 199076 | 0 |
| B | 0 | 191892 | 0 |
| C | 0 | 215158 | 0 |
| D | 0 | 285326 | 0 |
| Quadrant | Total seconds | Saturated seconds | Saturation percentage |
|---|---|---|---|
| A | 89377 | 1371 | 1.533952% |
| B | 89377 | 1098 | 1.228504% |
| C | 89377 | 1086 | 1.215078% |
| D | 89274 | 9486 | 10.625714% |
Noise dominated data is calculated using 1-second bins in cleaned event files. If a bin has >2000 counts, and if more than 50% of those come from <1% of pixels, then it is considered to be noise-dominated and hence unusable.
| Quadrant | # 1 sec bins | Bins with >0 counts | Bins with >2000 counts | High rate bins dominated by noise | Noise dominated (total time) | Noise dominated (detector-on time) | Marked lightcurve |
|---|---|---|---|---|---|---|---|
| A | 105583 | 89369 | 23 | 23 | 0.02% | 0.03% | 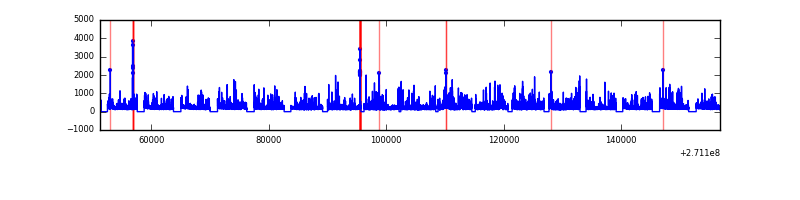 |
| B | 105583 | 89376 | 11 | 11 | 0.01% | 0.01% |  |
| C | 105583 | 89373 | 10 | 10 | 0.01% | 0.01% | 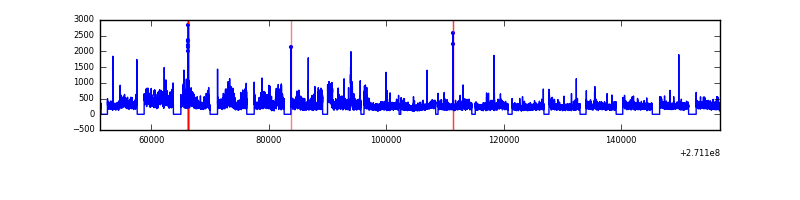 |
| D | 105583 | 89268 | 3088 | 3088 | 2.92% | 3.46% |  |
Top three noisy pixels from each quadrant. If the there are fewer than three noisy pixels in the level2.evt file, extra rows are filled as -1
| Pixel properties | Quadrant properties | ||||||
|---|---|---|---|---|---|---|---|
| Quadrant | DetID | PixID | Counts | Sigma | Mean | Median | Sigma |
| A | 15 | 249 | 1443259 | 1399.32 | 4798 | 4713 | 1028.0 |
| A | 14 | 238 | 1284389 | 1244.78 | 4798 | 4713 | 1028.0 |
| A | 14 | 237 | 415194 | 399.29 | 4798 | 4713 | 1028.0 |
| B | 4 | 142 | 369549 | 404.59 | 4874 | 4762 | 901.6 |
| B | 0 | 189 | 286930 | 312.96 | 4874 | 4762 | 901.6 |
| B | 3 | 209 | 235096 | 255.47 | 4874 | 4762 | 901.6 |
| C | 3 | 233 | 8760563 | 8525.14 | 4713 | 4672 | 1027.1 |
| C | 7 | 247 | 314251 | 301.42 | 4713 | 4672 | 1027.1 |
| C | 10 | 22 | 90182 | 83.26 | 4713 | 4672 | 1027.1 |
| D | 1 | 52 | 13732249 | 13001.28 | 4570 | 4416 | 1055.9 |
| D | 5 | 222 | 11267142 | 10666.64 | 4570 | 4416 | 1055.9 |
| D | 13 | 122 | 2837881 | 2683.5 | 4570 | 4416 | 1055.9 |
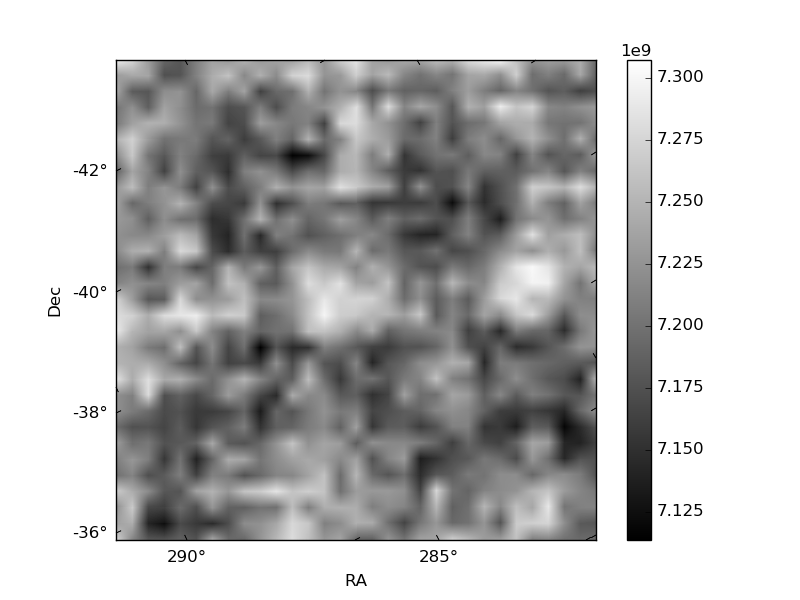
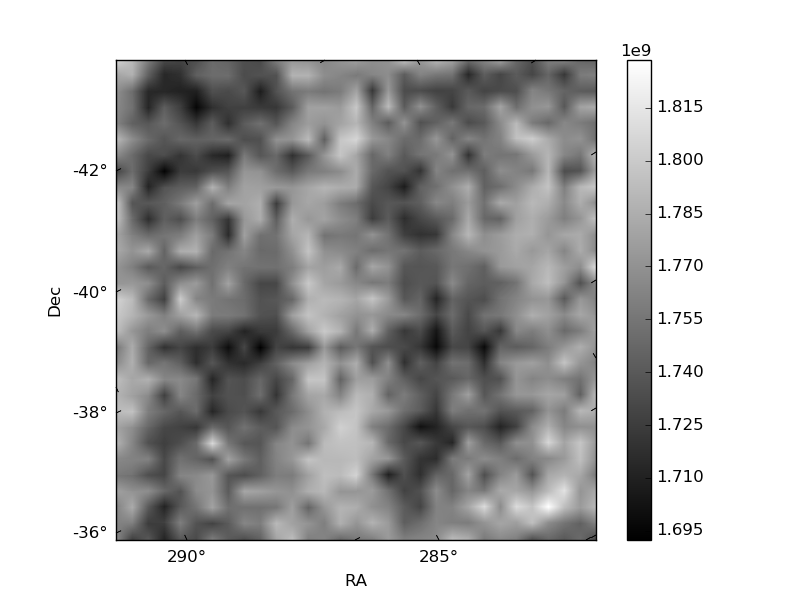
Histogram calculated using DETX and DETY for each event in the final _common_clean file
| Quadrant A |  |
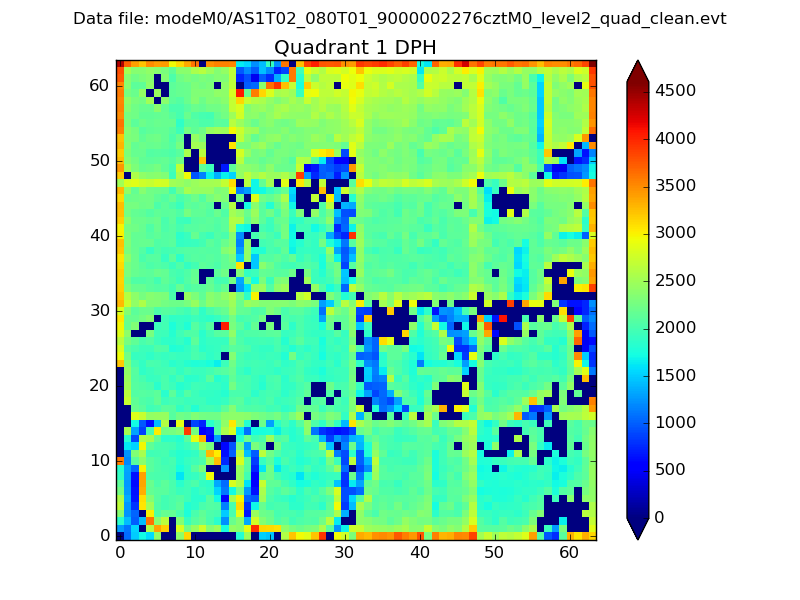 |
Quadrant B |
|---|---|---|---|
| Quadrant D |  |
 |
Quadrant C |
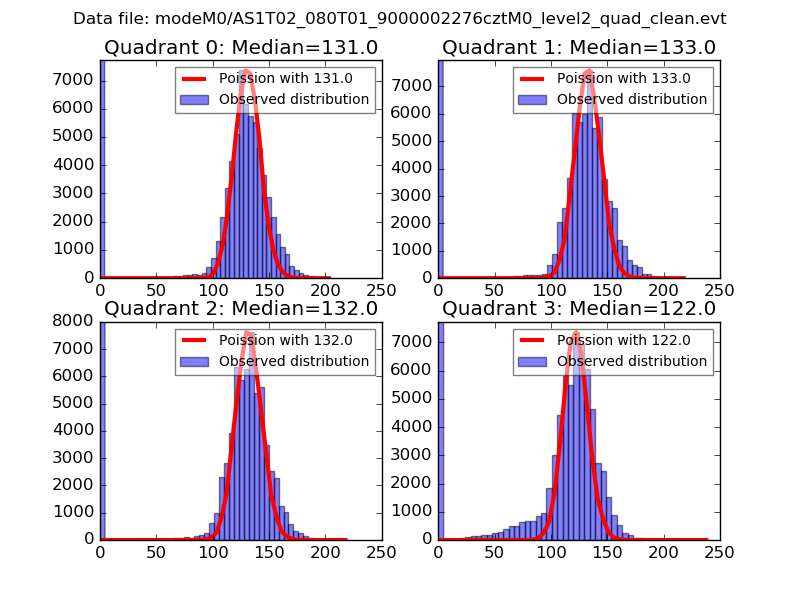
| Plot type | Count rate plots | Images |
|---|---|---|
| Comparison with Poisson distribution Blue bars denote a histogram of data divided into 1 sec bins. Red curve is a Poisson curve with rate = median count rate of data. |
 |
 |
| Quadrant-wise count rates Data is divided into 100 sec bins |
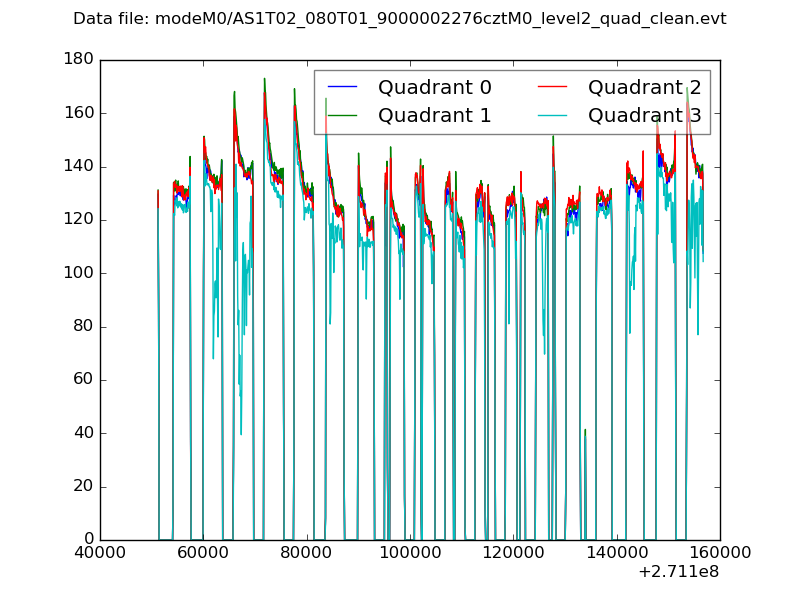 |
|
| Module-wise count rates for Quadrant A Data is divided into 100 sec bins |
 |
 |
| Module-wise count rates for Quadrant B Data is divided into 100 sec bins |
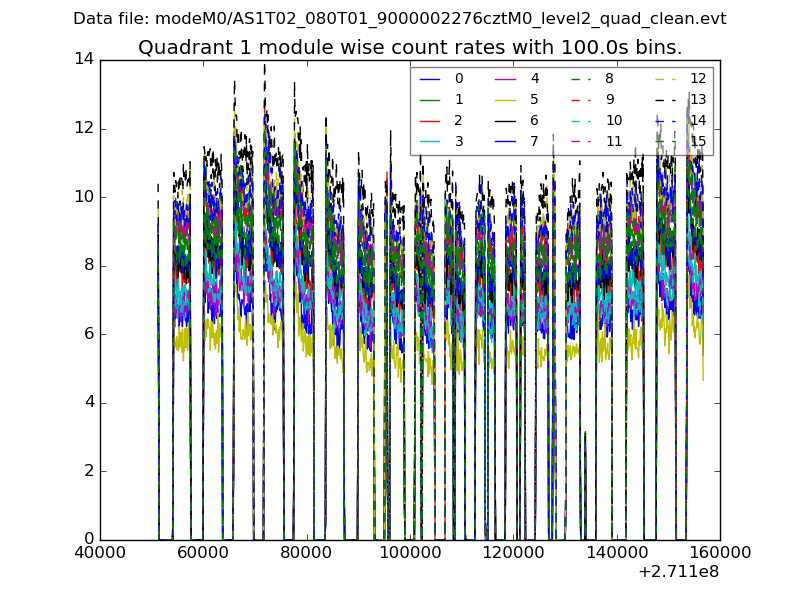 |
 |
| Module-wise count rates for Quadrant C Data is divided into 100 sec bins |
 |
 |
| Module-wise count rates for Quadrant D Data is divided into 100 sec bins |
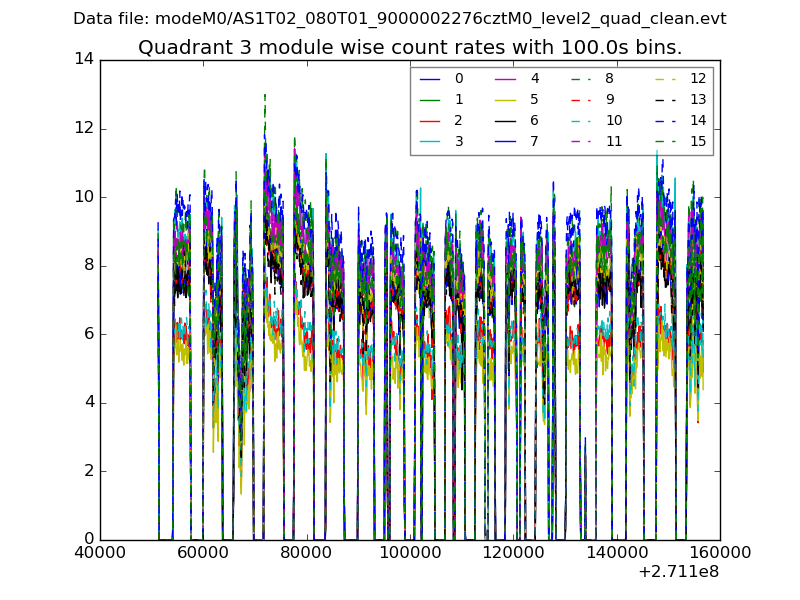 |
 |
| Parameter | Plot |
|---|---|
| CZT HV Monitor |  |
| D_VDD |  |
| Temperature 1 |  |
| Veto HV Monitor |  |
| Veto LLD |  |
| Alpha Counter |  |
| _CPM_Rate |  |
| CZT Counter |  |
| +2.5 Volts monitor |  |
| +5 Volts monitor |  |
| _ROLL_ROT |  |
| _Roll_DEC |  |
| _Roll_RA | 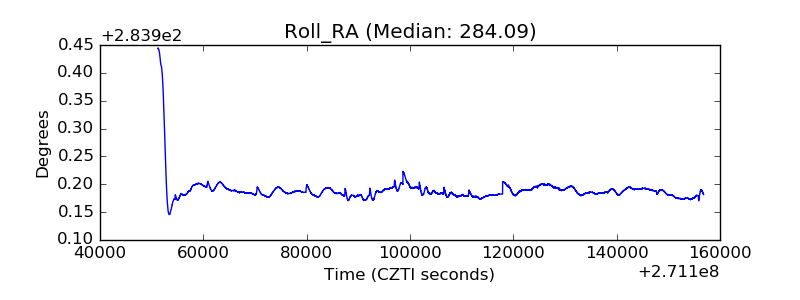 |
| Veto Counter | 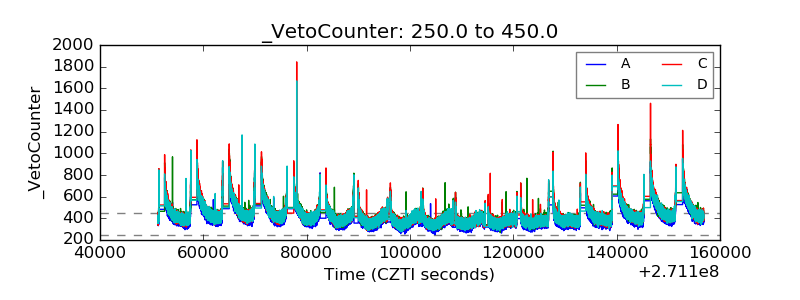 |