| Param | Original file | Final file |
|---|---|---|
| Filename | modeM0/AS1T02_076T01_9000002274cztM0_level2_bc.evt | modeM0/AS1T02_076T01_9000002274cztM0_level2_quad_clean.evt |
| Size (bytes) | 3,131,723,520 | 1,019,741,760 |
| Size | 2.9 GB | 972.5 MB |
| Events in quadrant A | 17,889,076 | 6,611,875 |
| Events in quadrant B | 17,593,641 | 6,675,572 |
| Events in quadrant C | 21,612,229 | 6,549,519 |
| Events in quadrant D | 32,935,486 | 6,198,311 |
| Mode SS | |||
|---|---|---|---|
| Quadrant | BADHDUFLAG | Total packets | Discarded packets |
| A | 0 | 1442 | 0 |
| B | 0 | 1442 | 0 |
| C | 0 | 1442 | 0 |
| D | 0 | 1442 | 0 |
| Mode M9 | |||
|---|---|---|---|
| Quadrant | BADHDUFLAG | Total packets | Discarded packets |
| A | 0 | 114 | 0 |
| B | 0 | 114 | 0 |
| C | 0 | 114 | 0 |
| D | 0 | 114 | 0 |
| Mode M0 | |||
|---|---|---|---|
| Quadrant | BADHDUFLAG | Total packets | Discarded packets |
| A | 0 | 161038 | 0 |
| B | 0 | 155899 | 0 |
| C | 0 | 168379 | 0 |
| D | 0 | 211053 | 0 |
| Quadrant | Total seconds | Saturated seconds | Saturation percentage |
|---|---|---|---|
| A | 70764 | 1764 | 2.492793% |
| B | 70765 | 1075 | 1.519113% |
| C | 70765 | 1573 | 2.222850% |
| D | 70765 | 3378 | 4.773546% |
Noise dominated data is calculated using 1-second bins in cleaned event files. If a bin has >2000 counts, and if more than 50% of those come from <1% of pixels, then it is considered to be noise-dominated and hence unusable.
| Quadrant | # 1 sec bins | Bins with >0 counts | Bins with >2000 counts | High rate bins dominated by noise | Noise dominated (total time) | Noise dominated (detector-on time) | Marked lightcurve |
|---|---|---|---|---|---|---|---|
| A | 82237 | 70765 | 42 | 42 | 0.05% | 0.06% |  |
| B | 82237 | 70764 | 64 | 64 | 0.08% | 0.09% | 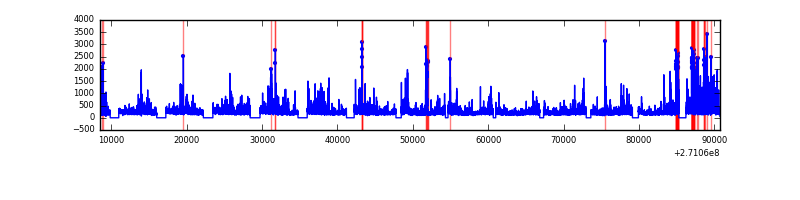 |
| C | 82237 | 70764 | 89 | 89 | 0.11% | 0.13% |  |
| D | 82237 | 70763 | 655 | 655 | 0.80% | 0.93% |  |
Top three noisy pixels from each quadrant. If the there are fewer than three noisy pixels in the level2.evt file, extra rows are filled as -1
| Pixel properties | Quadrant properties | ||||||
|---|---|---|---|---|---|---|---|
| Quadrant | DetID | PixID | Counts | Sigma | Mean | Median | Sigma |
| A | 14 | 238 | 2283401 | 2830.15 | 3702 | 3635 | 805.5 |
| A | 14 | 237 | 750552 | 927.24 | 3702 | 3635 | 805.5 |
| A | 9 | 143 | 229885 | 280.87 | 3702 | 3635 | 805.5 |
| B | 10 | 245 | 1176354 | 1667.6 | 3734 | 3643 | 703.2 |
| B | 3 | 209 | 264367 | 370.75 | 3734 | 3643 | 703.2 |
| B | 0 | 189 | 239891 | 335.95 | 3734 | 3643 | 703.2 |
| C | 3 | 233 | 6817930 | 8634.08 | 3588 | 3557 | 789.2 |
| C | 7 | 247 | 442222 | 555.81 | 3588 | 3557 | 789.2 |
| C | 3 | 9 | 172616 | 214.2 | 3588 | 3557 | 789.2 |
| D | 13 | 122 | 10485652 | 12537.25 | 3593 | 3468 | 836.1 |
| D | 1 | 20 | 2728994 | 3259.88 | 3593 | 3468 | 836.1 |
| D | 5 | 222 | 2311514 | 2760.55 | 3593 | 3468 | 836.1 |
Histogram calculated using DETX and DETY for each event in the final _common_clean file
| Quadrant A |  |
 |
Quadrant B |
|---|---|---|---|
| Quadrant D |  |
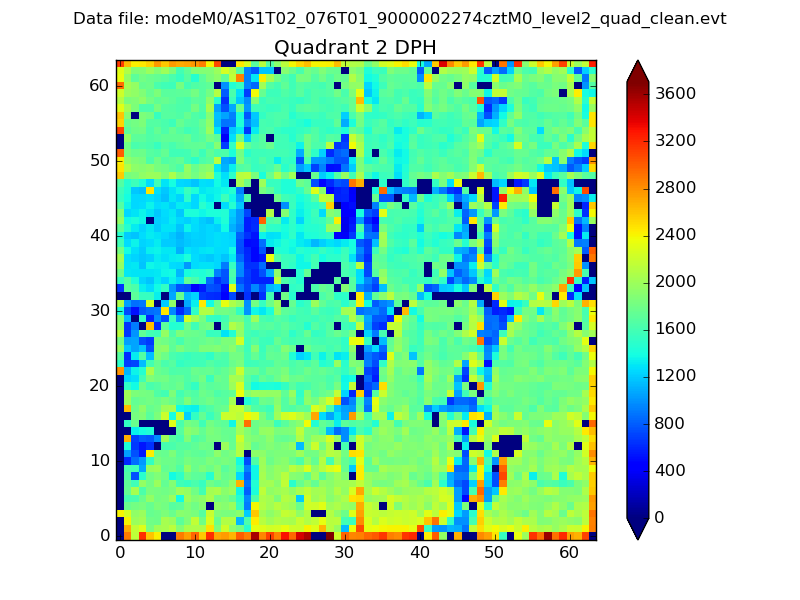 |
Quadrant C |
| Plot type | Count rate plots | Images |
|---|---|---|
| Comparison with Poisson distribution Blue bars denote a histogram of data divided into 1 sec bins. Red curve is a Poisson curve with rate = median count rate of data. |
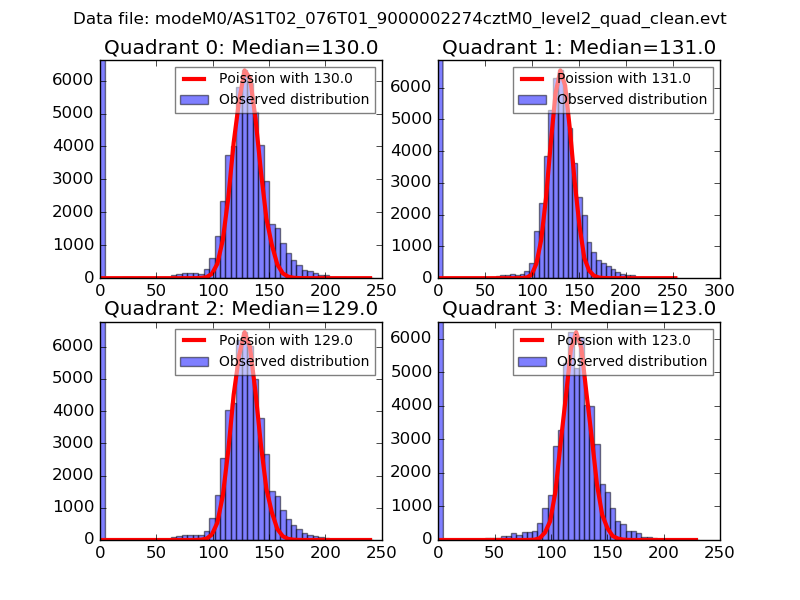 |
 |
| Quadrant-wise count rates Data is divided into 100 sec bins |
 |
|
| Module-wise count rates for Quadrant A Data is divided into 100 sec bins |
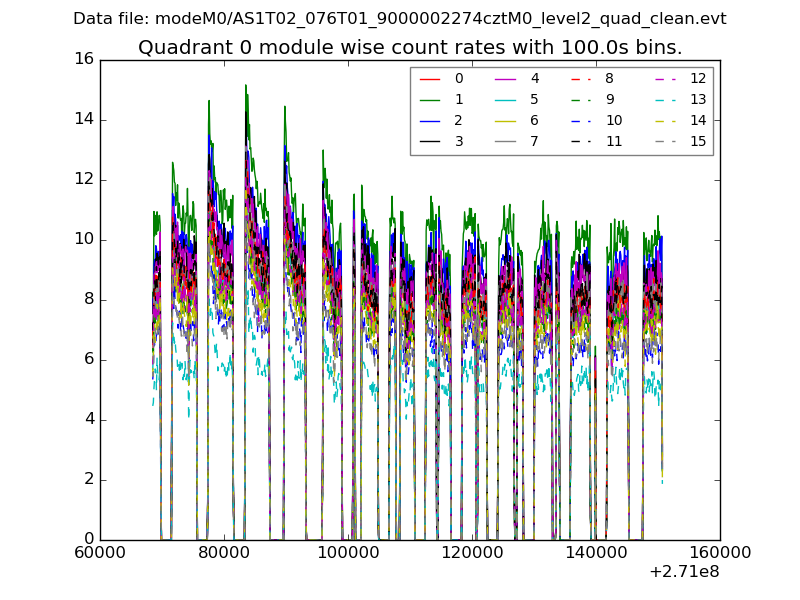 |
 |
| Module-wise count rates for Quadrant B Data is divided into 100 sec bins |
 |
 |
| Module-wise count rates for Quadrant C Data is divided into 100 sec bins |
 |
 |
| Module-wise count rates for Quadrant D Data is divided into 100 sec bins |
 |
 |
| Parameter | Plot |
|---|---|
| CZT HV Monitor |  |
| D_VDD |  |
| Temperature 1 |  |
| Veto HV Monitor |  |
| Veto LLD |  |
| Alpha Counter |  |
| _CPM_Rate |  |
| CZT Counter |  |
| +2.5 Volts monitor |  |
| +5 Volts monitor |  |
| _ROLL_ROT | 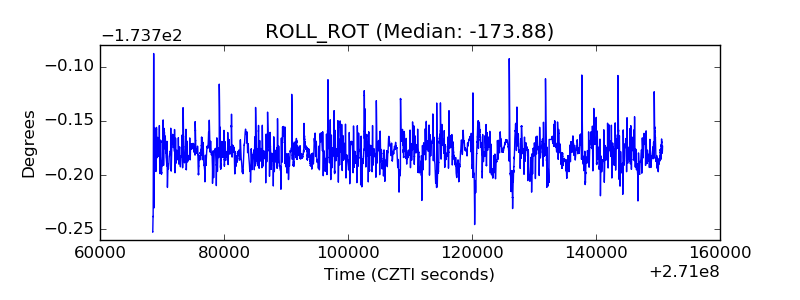 |
| _Roll_DEC | 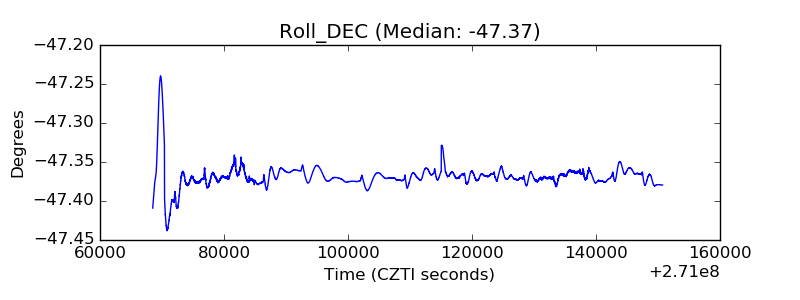 |
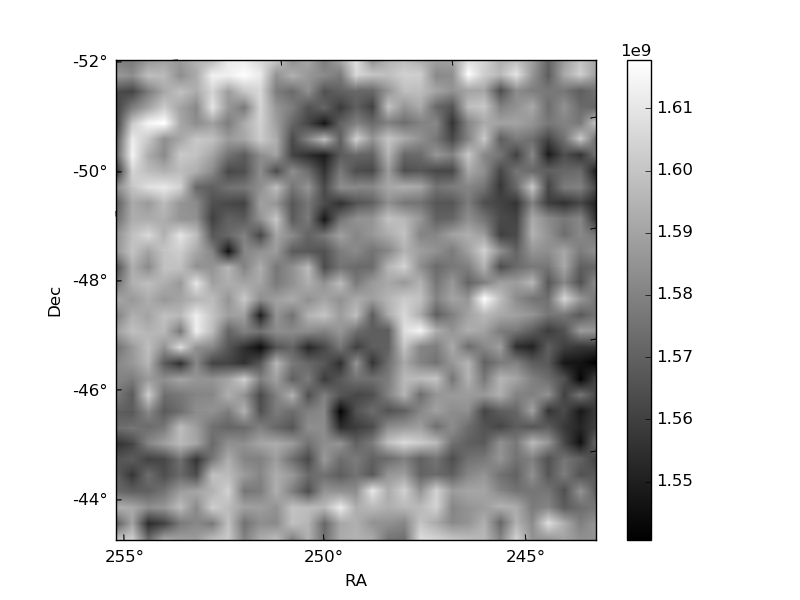
| _Roll_RA |  |
| Veto Counter |  |