| Param | Original file | Final file |
|---|---|---|
| Filename | modeM0/AS1G08_072T01_9000002272cztM0_level2_bc.evt | modeM0/AS1G08_072T01_9000002272cztM0_level2_quad_clean.evt |
| Size (bytes) | 3,413,897,280 | 915,805,440 |
| Size | 3.2 GB | 873.4 MB |
| Events in quadrant A | 15,819,023 | 5,928,631 |
| Events in quadrant B | 17,752,696 | 6,028,051 |
| Events in quadrant C | 18,456,103 | 5,945,056 |
| Events in quadrant D | 46,603,815 | 5,039,629 |
| Mode SS | |||
|---|---|---|---|
| Quadrant | BADHDUFLAG | Total packets | Discarded packets |
| A | 0 | 1420 | 0 |
| B | 0 | 1420 | 0 |
| C | 0 | 1420 | 0 |
| D | 0 | 1418 | 0 |
| Mode M0 | |||
|---|---|---|---|
| Quadrant | BADHDUFLAG | Total packets | Discarded packets |
| A | 0 | 152026 | 0 |
| B | 0 | 156265 | 0 |
| C | 0 | 156747 | 0 |
| D | 0 | 274219 | 0 |
| Mode M9 | |||
|---|---|---|---|
| Quadrant | BADHDUFLAG | Total packets | Discarded packets |
| A | 0 | 115 | 0 |
| B | 0 | 115 | 0 |
| C | 0 | 115 | 0 |
| D | 0 | 115 | 0 |
| Quadrant | Total seconds | Saturated seconds | Saturation percentage |
|---|---|---|---|
| A | 69923 | 1324 | 1.893511% |
| B | 69926 | 1147 | 1.640305% |
| C | 69919 | 984 | 1.407343% |
| D | 69919 | 12691 | 18.151003% |
Noise dominated data is calculated using 1-second bins in cleaned event files. If a bin has >2000 counts, and if more than 50% of those come from <1% of pixels, then it is considered to be noise-dominated and hence unusable.
| Quadrant | # 1 sec bins | Bins with >0 counts | Bins with >2000 counts | High rate bins dominated by noise | Noise dominated (total time) | Noise dominated (detector-on time) | Marked lightcurve |
|---|---|---|---|---|---|---|---|
| A | 81318 | 69925 | 18 | 18 | 0.02% | 0.03% |  |
| B | 81318 | 69924 | 49 | 49 | 0.06% | 0.07% |  |
| C | 81318 | 69924 | 8 | 8 | 0.01% | 0.01% |  |
| D | 81318 | 69922 | 1963 | 1963 | 2.41% | 2.81% |  |
Top three noisy pixels from each quadrant. If the there are fewer than three noisy pixels in the level2.evt file, extra rows are filled as -1
| Pixel properties | Quadrant properties | ||||||
|---|---|---|---|---|---|---|---|
| Quadrant | DetID | PixID | Counts | Sigma | Mean | Median | Sigma |
| A | 14 | 238 | 814083 | 1032.16 | 3639 | 3580 | 785.3 |
| A | 7 | 16 | 349500 | 440.52 | 3639 | 3580 | 785.3 |
| A | 9 | 143 | 253605 | 318.4 | 3639 | 3580 | 785.3 |
| B | 10 | 16 | 1012928 | 1458.98 | 3692 | 3601 | 691.8 |
| B | 0 | 197 | 460146 | 659.93 | 3692 | 3601 | 691.8 |
| B | 3 | 209 | 287863 | 410.9 | 3692 | 3601 | 691.8 |
| C | 3 | 233 | 3616083 | 4596.92 | 3559 | 3509 | 785.9 |
| C | 7 | 247 | 714176 | 904.31 | 3559 | 3509 | 785.9 |
| C | 10 | 22 | 69332 | 83.76 | 3559 | 3509 | 785.9 |
| D | 13 | 122 | 14851241 | 19349.21 | 3288 | 3170 | 767.4 |
| D | 9 | 68 | 9868679 | 12856.2 | 3288 | 3170 | 767.4 |
| D | 7 | 223 | 3036967 | 3953.48 | 3288 | 3170 | 767.4 |
Histogram calculated using DETX and DETY for each event in the final _common_clean file
| Quadrant A | 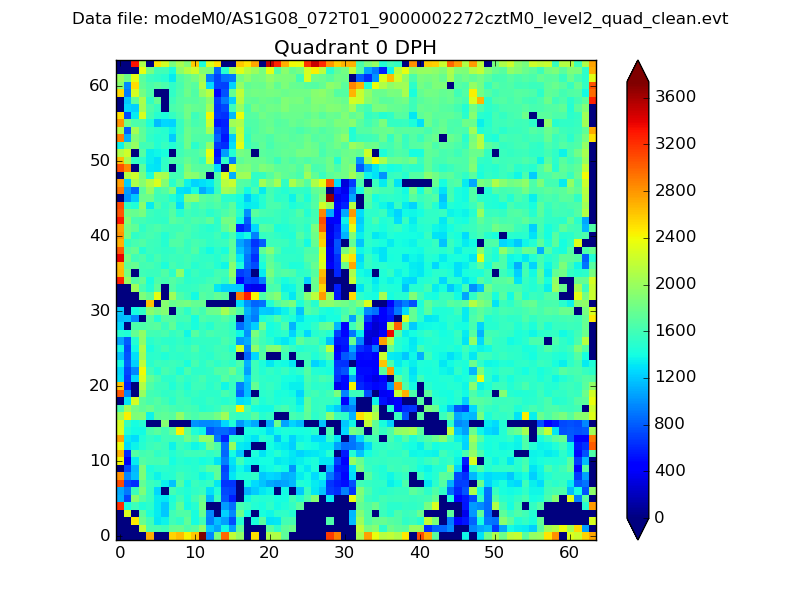 |
 |
Quadrant B |
|---|---|---|---|
| Quadrant D |  |
 |
Quadrant C |
| Plot type | Count rate plots | Images |
|---|---|---|
| Comparison with Poisson distribution Blue bars denote a histogram of data divided into 1 sec bins. Red curve is a Poisson curve with rate = median count rate of data. |
 |
 |
| Quadrant-wise count rates Data is divided into 100 sec bins |
 |
|
| Module-wise count rates for Quadrant A Data is divided into 100 sec bins |
 |
 |
| Module-wise count rates for Quadrant B Data is divided into 100 sec bins |
 |
 |
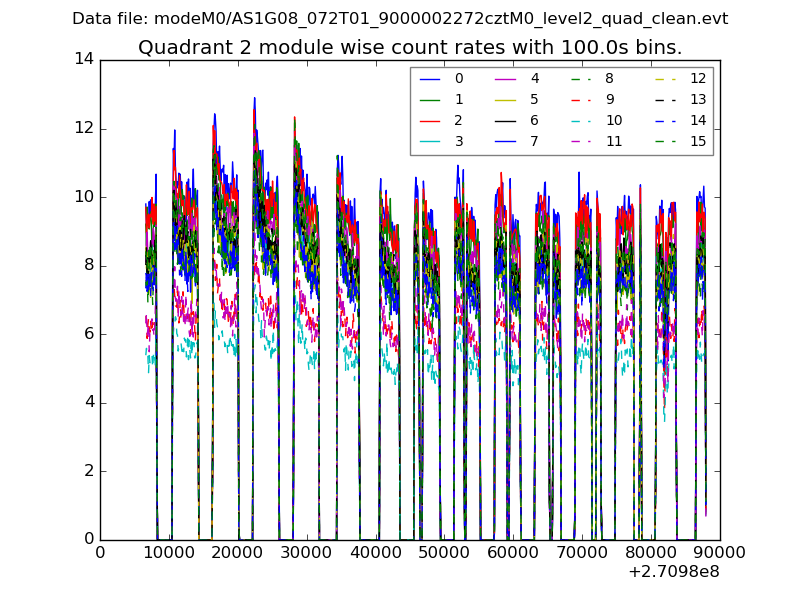
| Module-wise count rates for Quadrant C Data is divided into 100 sec bins |
 |
 |
| Module-wise count rates for Quadrant D Data is divided into 100 sec bins |
 |
 |
| Parameter | Plot |
|---|---|
| CZT HV Monitor |  |
| D_VDD | 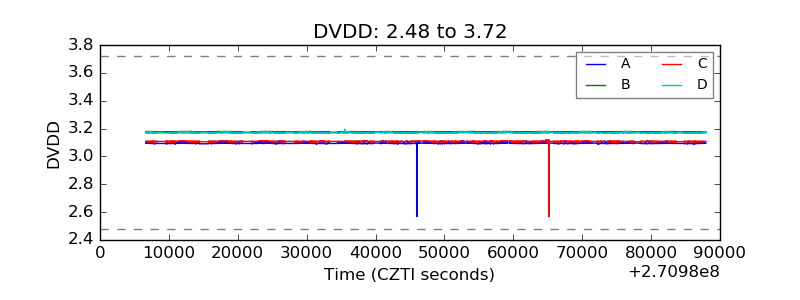 |
| Temperature 1 |  |
| Veto HV Monitor |  |
| Veto LLD | 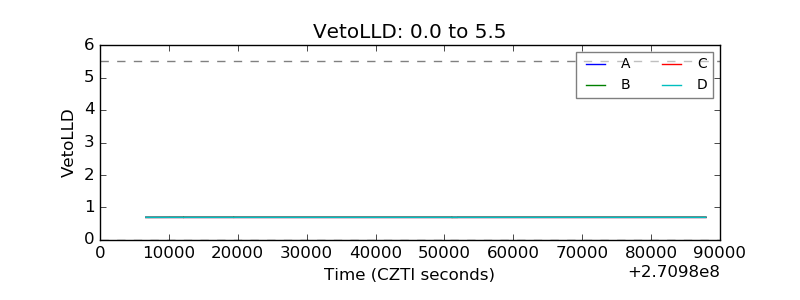 |
| Alpha Counter |  |
| _CPM_Rate | 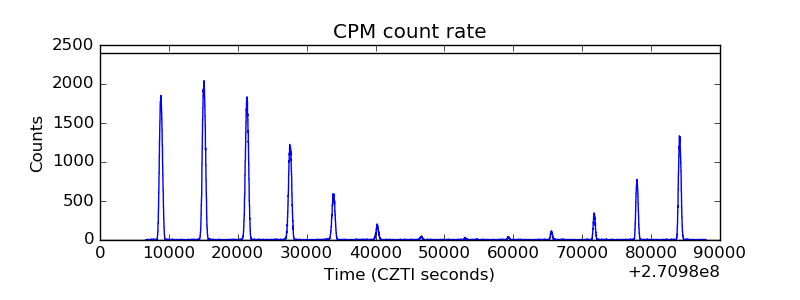 |
| CZT Counter |  |
| +2.5 Volts monitor | 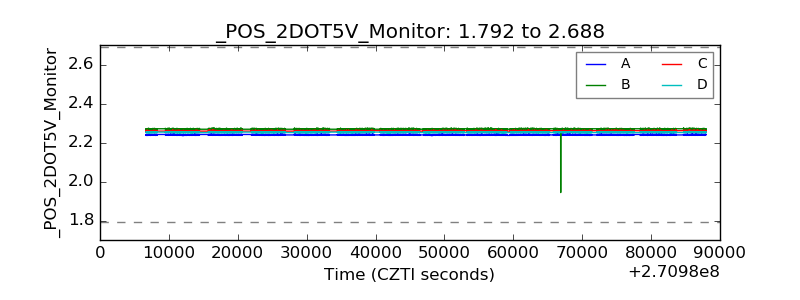 |
| +5 Volts monitor | 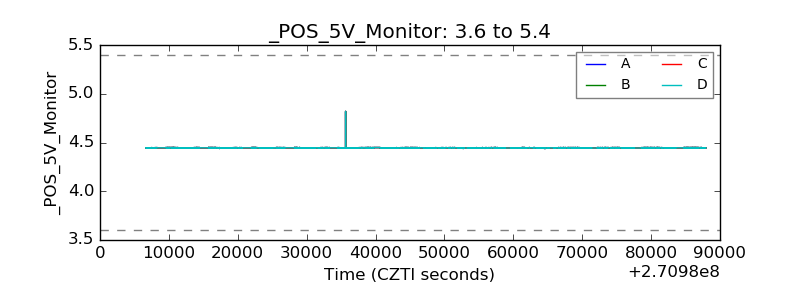 |
| _ROLL_ROT | 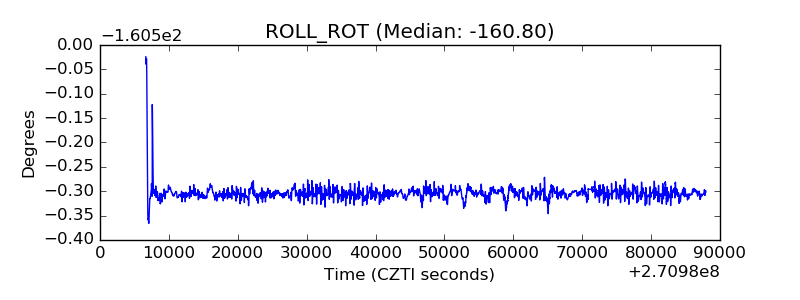 |
| _Roll_DEC |  |
| _Roll_RA | 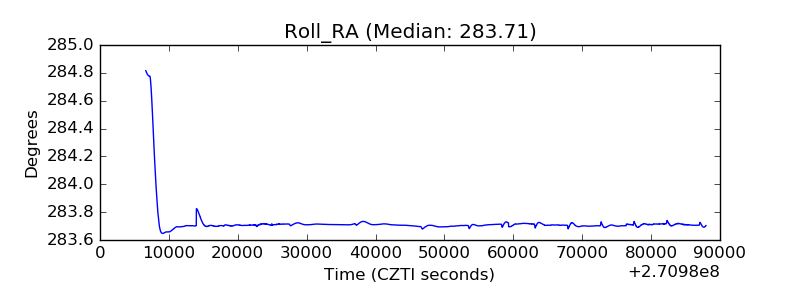 |
| Veto Counter | 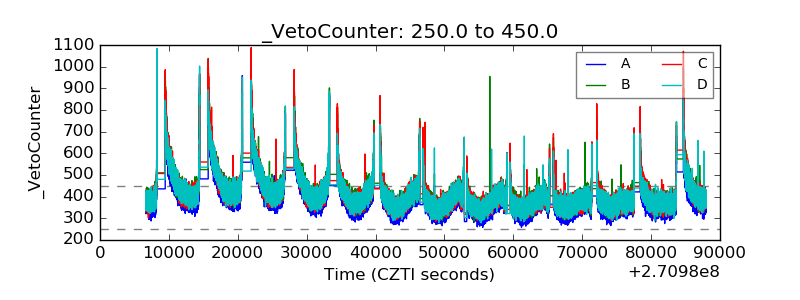 |