| Param | Original file | Final file |
|---|---|---|
| Filename | modeM0/AS1C03_001T01_9000002270cztM0_level2_bc.evt | modeM0/AS1C03_001T01_9000002270cztM0_level2_quad_clean.evt |
| Size (bytes) | 4,981,628,160 | 1,281,651,840 |
| Size | 4.6 GB | 1.2 GB |
| Events in quadrant A | 22,893,496 | 8,437,354 |
| Events in quadrant B | 34,071,650 | 8,443,767 |
| Events in quadrant C | 20,405,935 | 8,699,506 |
| Events in quadrant D | 67,776,013 | 7,460,572 |
| Mode SS | |||
|---|---|---|---|
| Quadrant | BADHDUFLAG | Total packets | Discarded packets |
| A | 0 | 1714 | 0 |
| B | 0 | 1714 | 0 |
| C | 0 | 1714 | 0 |
| D | 0 | 1714 | 0 |
| Mode M0 | |||
|---|---|---|---|
| Quadrant | BADHDUFLAG | Total packets | Discarded packets |
| A | 0 | 206612 | 0 |
| B | 0 | 238434 | 0 |
| C | 0 | 179635 | 0 |
| D | 0 | 368121 | 0 |
| Mode M9 | |||
|---|---|---|---|
| Quadrant | BADHDUFLAG | Total packets | Discarded packets |
| A | 0 | 143 | 0 |
| B | 0 | 143 | 0 |
| C | 0 | 143 | 0 |
| D | 0 | 143 | 0 |
| Quadrant | Total seconds | Saturated seconds | Saturation percentage |
|---|---|---|---|
| A | 84181 | 4680 | 5.559449% |
| B | 84181 | 6158 | 7.315190% |
| C | 84181 | 815 | 0.968152% |
| D | 84181 | 19459 | 23.115667% |
Noise dominated data is calculated using 1-second bins in cleaned event files. If a bin has >2000 counts, and if more than 50% of those come from <1% of pixels, then it is considered to be noise-dominated and hence unusable.
| Quadrant | # 1 sec bins | Bins with >0 counts | Bins with >2000 counts | High rate bins dominated by noise | Noise dominated (total time) | Noise dominated (detector-on time) | Marked lightcurve |
|---|---|---|---|---|---|---|---|
| A | 98462 | 84091 | 53 | 53 | 0.05% | 0.06% |  |
| B | 98462 | 84173 | 544 | 544 | 0.55% | 0.65% | 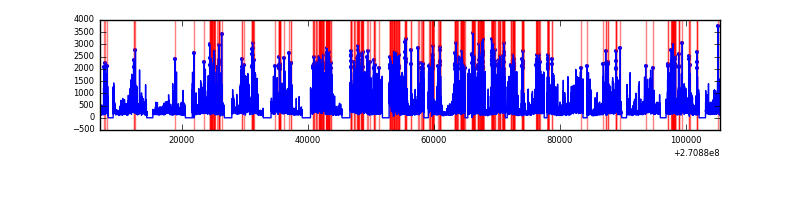 |
| C | 98462 | 84175 | 1 | 1 | 0.00% | 0.00% |  |
| D | 98462 | 84173 | 2318 | 2318 | 2.35% | 2.75% |  |
Top three noisy pixels from each quadrant. If the there are fewer than three noisy pixels in the level2.evt file, extra rows are filled as -1
| Pixel properties | Quadrant properties | ||||||
|---|---|---|---|---|---|---|---|
| Quadrant | DetID | PixID | Counts | Sigma | Mean | Median | Sigma |
| A | 14 | 238 | 4745530 | 5220.76 | 4192 | 4116 | 908.2 |
| A | 14 | 237 | 1067524 | 1170.91 | 4192 | 4116 | 908.2 |
| A | 9 | 143 | 339542 | 369.34 | 4192 | 4116 | 908.2 |
| B | 10 | 245 | 9932174 | 12318.62 | 4220 | 4109 | 805.9 |
| B | 10 | 16 | 1757341 | 2175.39 | 4220 | 4109 | 805.9 |
| B | 8 | 3 | 1737919 | 2151.29 | 4220 | 4109 | 805.9 |
| C | 3 | 233 | 3643645 | 3835.03 | 4240 | 4192 | 949.0 |
| C | 7 | 247 | 117656 | 119.56 | 4240 | 4192 | 949.0 |
| C | 0 | 207 | 30601 | 27.83 | 4240 | 4192 | 949.0 |
| D | 13 | 122 | 39771256 | 41521.59 | 3955 | 3806 | 957.8 |
| D | 2 | 33 | 4011540 | 4184.51 | 3955 | 3806 | 957.8 |
| D | 9 | 68 | 2749535 | 2866.84 | 3955 | 3806 | 957.8 |
Histogram calculated using DETX and DETY for each event in the final _common_clean file
| Quadrant A |  |
 |
Quadrant B |
|---|---|---|---|
| Quadrant D | 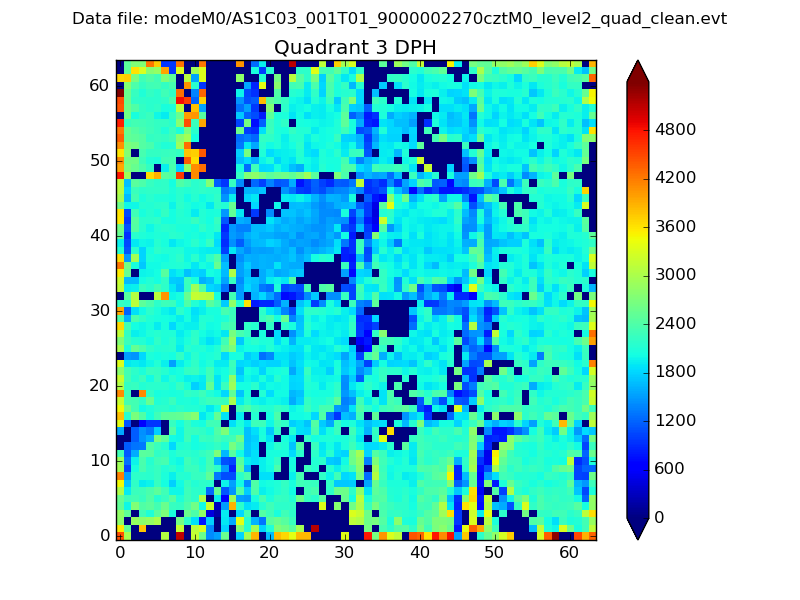 |
 |
Quadrant C |
| Plot type | Count rate plots | Images |
|---|---|---|
| Comparison with Poisson distribution Blue bars denote a histogram of data divided into 1 sec bins. Red curve is a Poisson curve with rate = median count rate of data. |
 |
 |
| Quadrant-wise count rates Data is divided into 100 sec bins |
 |
|
| Module-wise count rates for Quadrant A Data is divided into 100 sec bins |
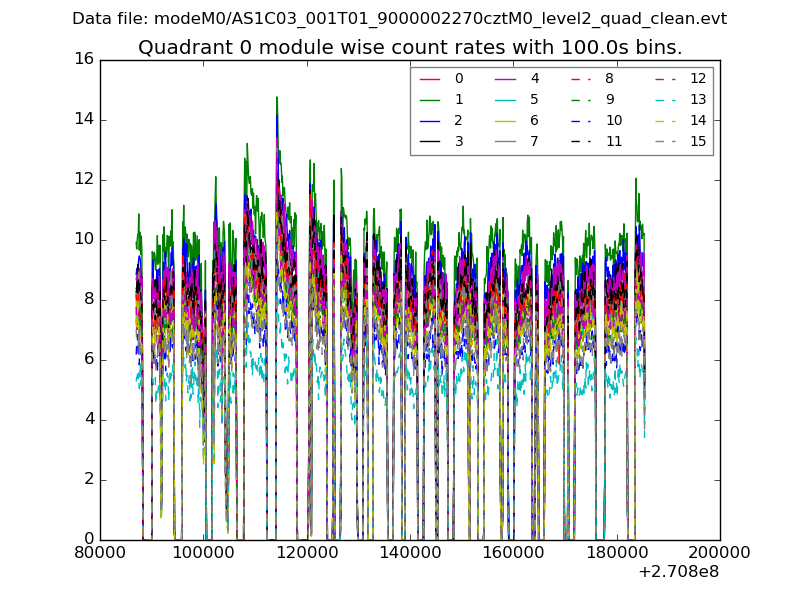 |
 |
| Module-wise count rates for Quadrant B Data is divided into 100 sec bins |
 |
 |
| Module-wise count rates for Quadrant C Data is divided into 100 sec bins |
 |
 |
| Module-wise count rates for Quadrant D Data is divided into 100 sec bins |
 |
 |
| Parameter | Plot |
|---|---|
| CZT HV Monitor |  |
| D_VDD | 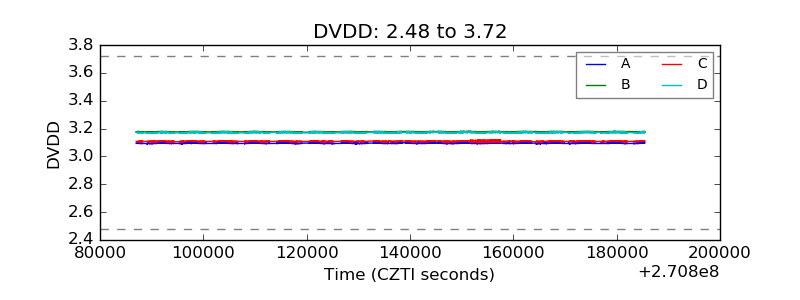 |
| Temperature 1 |  |
| Veto HV Monitor | 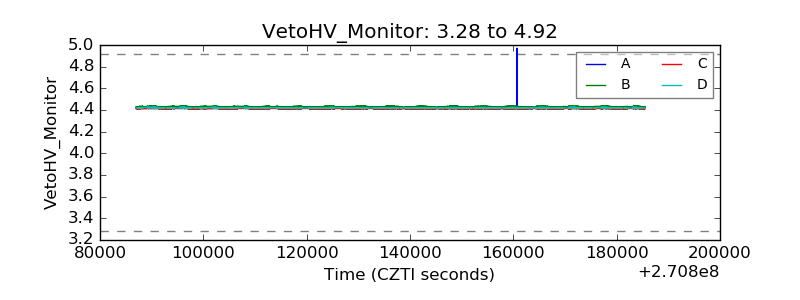 |
| Veto LLD |  |
| Alpha Counter |  |
| _CPM_Rate |  |
| CZT Counter |  |
| +2.5 Volts monitor |  |
| +5 Volts monitor |  |
| _ROLL_ROT |  |
| _Roll_DEC | 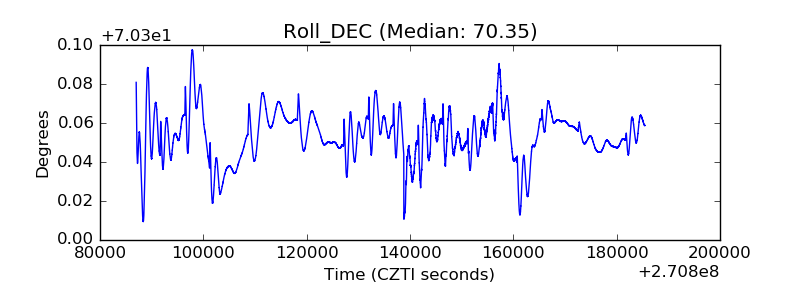 |
| _Roll_RA |  |
| Veto Counter | 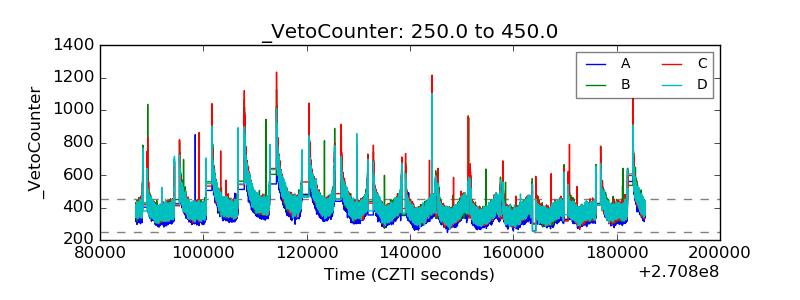 |