| Param | Original file | Final file |
|---|---|---|
| Filename | modeM0/AS1G08_035T01_9000002268cztM0_level2_bc.evt | modeM0/AS1G08_035T01_9000002268cztM0_level2_quad_clean.evt |
| Size (bytes) | 892,699,200 | 268,464,960 |
| Size | 851.3 MB | 256.0 MB |
| Events in quadrant A | 6,245,346 | 1,631,029 |
| Events in quadrant B | 7,875,453 | 1,692,768 |
| Events in quadrant C | 4,572,479 | 1,720,463 |
| Events in quadrant D | 6,843,367 | 1,577,959 |
| Mode M9 | |||
|---|---|---|---|
| Quadrant | BADHDUFLAG | Total packets | Discarded packets |
| A | 0 | 19 | 0 |
| B | 0 | 19 | 0 |
| C | 0 | 19 | 0 |
| D | 0 | 19 | 0 |
| Mode M0 | |||
|---|---|---|---|
| Quadrant | BADHDUFLAG | Total packets | Discarded packets |
| A | 0 | 57466 | 0 |
| B | 0 | 57476 | 0 |
| C | 0 | 44703 | 0 |
| D | 0 | 54837 | 0 |
| Mode SS | |||
|---|---|---|---|
| Quadrant | BADHDUFLAG | Total packets | Discarded packets |
| A | 0 | 446 | 0 |
| B | 0 | 446 | 0 |
| C | 0 | 446 | 0 |
| D | 0 | 446 | 0 |
| Quadrant | Total seconds | Saturated seconds | Saturation percentage |
|---|---|---|---|
| A | 21906 | 1822 | 8.317356% |
| B | 21906 | 1049 | 4.788642% |
| C | 21906 | 111 | 0.506710% |
| D | 21906 | 932 | 4.254542% |
Noise dominated data is calculated using 1-second bins in cleaned event files. If a bin has >2000 counts, and if more than 50% of those come from <1% of pixels, then it is considered to be noise-dominated and hence unusable.
| Quadrant | # 1 sec bins | Bins with >0 counts | Bins with >2000 counts | High rate bins dominated by noise | Noise dominated (total time) | Noise dominated (detector-on time) | Marked lightcurve |
|---|---|---|---|---|---|---|---|
| A | 23882 | 21899 | 8 | 8 | 0.03% | 0.04% | 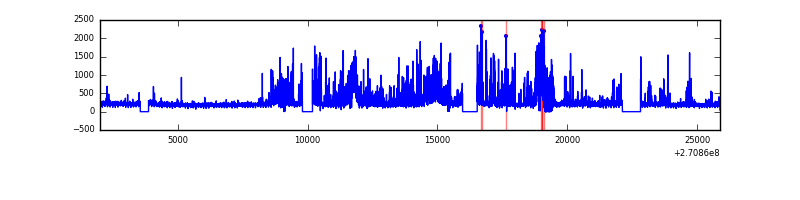 |
| B | 23882 | 21906 | 162 | 162 | 0.68% | 0.74% |  |
| C | 23882 | 21907 | 0 | 0 | 0.00% | 0.00% | 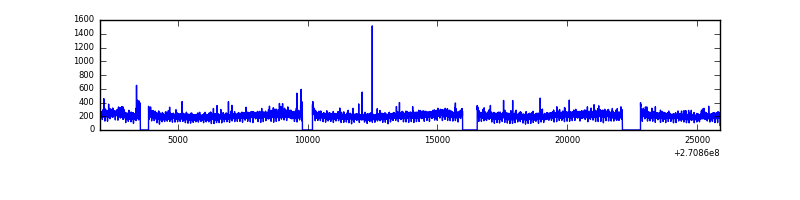 |
| D | 23882 | 21905 | 68 | 68 | 0.28% | 0.31% |  |
Top three noisy pixels from each quadrant. If the there are fewer than three noisy pixels in the level2.evt file, extra rows are filled as -1
| Pixel properties | Quadrant properties | ||||||
|---|---|---|---|---|---|---|---|
| Quadrant | DetID | PixID | Counts | Sigma | Mean | Median | Sigma |
| A | 14 | 238 | 1872923 | 8100.16 | 1033 | 1009 | 231.1 |
| A | 14 | 237 | 294317 | 1269.2 | 1033 | 1009 | 231.1 |
| A | 9 | 143 | 55837 | 237.25 | 1033 | 1009 | 231.1 |
| B | 10 | 16 | 1488206 | 7089.83 | 1074 | 1044 | 209.8 |
| B | 10 | 245 | 1304440 | 6213.75 | 1074 | 1044 | 209.8 |
| B | 8 | 3 | 369385 | 1756.01 | 1074 | 1044 | 209.8 |
| C | 3 | 233 | 416288 | 1755.3 | 1054 | 1038 | 236.6 |
| C | 8 | 128 | 11270 | 43.25 | 1054 | 1038 | 236.6 |
| C | 7 | 247 | 9672 | 36.5 | 1054 | 1038 | 236.6 |
| D | 9 | 68 | 730846 | 2974.46 | 1034 | 994 | 245.4 |
| D | 1 | 255 | 554733 | 2256.72 | 1034 | 994 | 245.4 |
| D | 2 | 33 | 441637 | 1795.81 | 1034 | 994 | 245.4 |
Histogram calculated using DETX and DETY for each event in the final _common_clean file
| Quadrant A |  |
 |
Quadrant B |
|---|---|---|---|
| Quadrant D |  |
 |
Quadrant C |
| Plot type | Count rate plots | Images |
|---|---|---|
| Comparison with Poisson distribution Blue bars denote a histogram of data divided into 1 sec bins. Red curve is a Poisson curve with rate = median count rate of data. |
 |
 |
| Quadrant-wise count rates Data is divided into 100 sec bins |
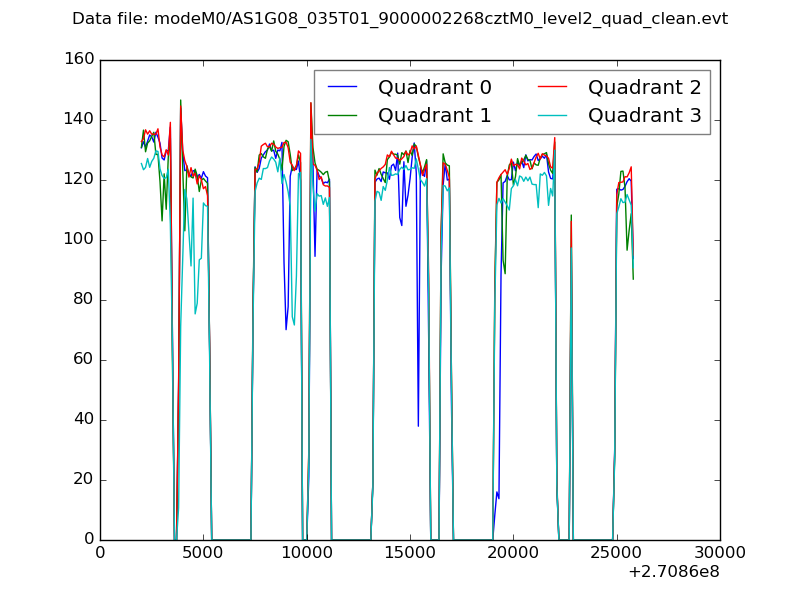 |
|
| Module-wise count rates for Quadrant A Data is divided into 100 sec bins |
 |
 |
| Module-wise count rates for Quadrant B Data is divided into 100 sec bins |
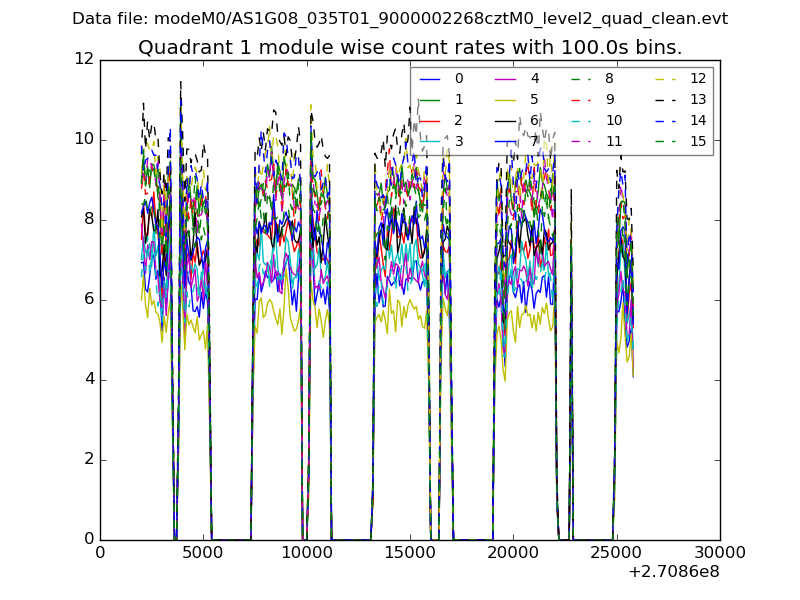 |
 |
| Module-wise count rates for Quadrant C Data is divided into 100 sec bins |
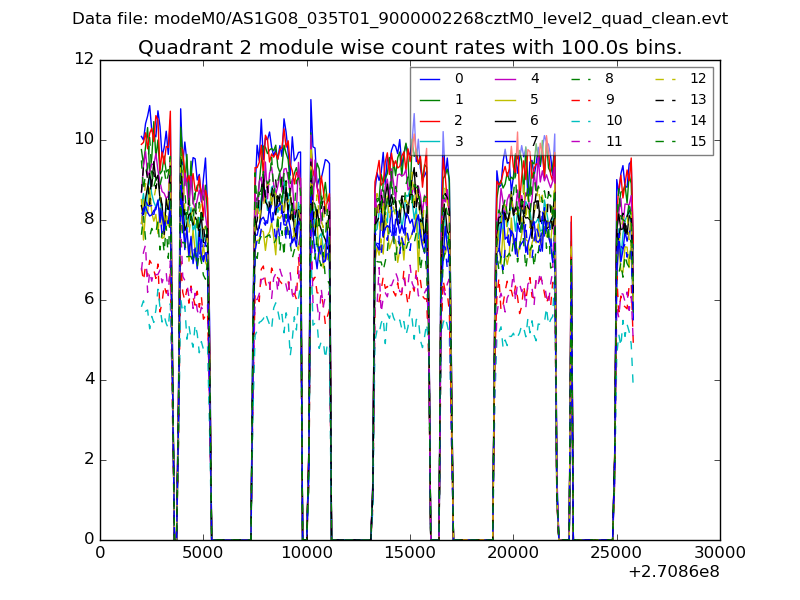 |
 |
| Module-wise count rates for Quadrant D Data is divided into 100 sec bins |
 |
 |
| Parameter | Plot |
|---|---|
| CZT HV Monitor |  |
| D_VDD |  |
| Temperature 1 | 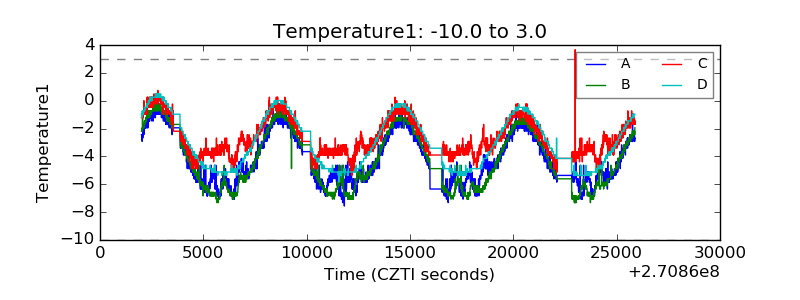 |
| Veto HV Monitor |  |
| Veto LLD |  |
| Alpha Counter |  |
| _CPM_Rate |  |
| CZT Counter |  |
| +2.5 Volts monitor |  |
| +5 Volts monitor |  |
| _ROLL_ROT |  |
| _Roll_DEC |  |
| _Roll_RA |  |
| Veto Counter |  |