| Param | Original file | Final file |
|---|---|---|
| Filename | modeM0/AS1A04_049T01_9000002266cztM0_level2_bc.evt | modeM0/AS1A04_049T01_9000002266cztM0_level2_quad_clean.evt |
| Size (bytes) | 706,861,440 | 258,001,920 |
| Size | 674.1 MB | 246.0 MB |
| Events in quadrant A | 3,756,418 | 1,678,546 |
| Events in quadrant B | 3,962,965 | 1,690,885 |
| Events in quadrant C | 8,079,839 | 1,654,936 |
| Events in quadrant D | 4,434,327 | 1,607,728 |
| Mode M9 | |||
|---|---|---|---|
| Quadrant | BADHDUFLAG | Total packets | Discarded packets |
| A | 0 | 28 | 0 |
| B | 0 | 28 | 0 |
| C | 0 | 28 | 0 |
| D | 0 | 28 | 0 |
| Mode M0 | |||
|---|---|---|---|
| Quadrant | BADHDUFLAG | Total packets | Discarded packets |
| A | 0 | 36531 | 0 |
| B | 0 | 37010 | 0 |
| C | 0 | 49417 | 0 |
| D | 0 | 38788 | 0 |
| Mode SS | |||
|---|---|---|---|
| Quadrant | BADHDUFLAG | Total packets | Discarded packets |
| A | 0 | 350 | 0 |
| B | 0 | 350 | 0 |
| C | 0 | 350 | 0 |
| D | 0 | 350 | 0 |
| Quadrant | Total seconds | Saturated seconds | Saturation percentage |
|---|---|---|---|
| A | 17153 | 203 | 1.183466% |
| B | 17153 | 205 | 1.195126% |
| C | 17153 | 481 | 2.804174% |
| D | 17153 | 320 | 1.865563% |
Noise dominated data is calculated using 1-second bins in cleaned event files. If a bin has >2000 counts, and if more than 50% of those come from <1% of pixels, then it is considered to be noise-dominated and hence unusable.
| Quadrant | # 1 sec bins | Bins with >0 counts | Bins with >2000 counts | High rate bins dominated by noise | Noise dominated (total time) | Noise dominated (detector-on time) | Marked lightcurve |
|---|---|---|---|---|---|---|---|
| A | 19929 | 17153 | 7 | 7 | 0.04% | 0.04% |  |
| B | 19929 | 17153 | 1 | 1 | 0.01% | 0.01% | 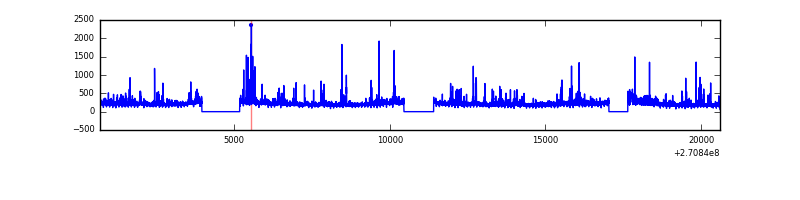 |
| C | 19929 | 17152 | 10 | 10 | 0.05% | 0.06% |  |
| D | 19929 | 17153 | 39 | 39 | 0.20% | 0.23% |  |
Top three noisy pixels from each quadrant. If the there are fewer than three noisy pixels in the level2.evt file, extra rows are filled as -1
| Pixel properties | Quadrant properties | ||||||
|---|---|---|---|---|---|---|---|
| Quadrant | DetID | PixID | Counts | Sigma | Mean | Median | Sigma |
| A | 14 | 238 | 173023 | 900.94 | 865 | 847 | 191.1 |
| A | 14 | 237 | 103927 | 539.38 | 865 | 847 | 191.1 |
| A | 3 | 80 | 71342 | 368.88 | 865 | 847 | 191.1 |
| B | 8 | 3 | 156683 | 937.28 | 871 | 848 | 166.3 |
| B | 4 | 173 | 120762 | 721.23 | 871 | 848 | 166.3 |
| B | 10 | 245 | 83857 | 499.26 | 871 | 848 | 166.3 |
| C | 3 | 233 | 4774967 | 25524.25 | 841 | 830 | 187.0 |
| C | 5 | 96 | 10600 | 52.23 | 841 | 830 | 187.0 |
| C | 13 | 61 | 4879 | 21.65 | 841 | 830 | 187.0 |
| D | 2 | 33 | 408952 | 2013.18 | 857 | 827 | 202.7 |
| D | 1 | 255 | 181279 | 890.13 | 857 | 827 | 202.7 |
| D | 5 | 222 | 127649 | 625.58 | 857 | 827 | 202.7 |
Histogram calculated using DETX and DETY for each event in the final _common_clean file
| Quadrant A |  |
 |
Quadrant B |
|---|---|---|---|
| Quadrant D |  |
 |
Quadrant C |
| Plot type | Count rate plots | Images |
|---|---|---|
| Comparison with Poisson distribution Blue bars denote a histogram of data divided into 1 sec bins. Red curve is a Poisson curve with rate = median count rate of data. |
 |
 |
| Quadrant-wise count rates Data is divided into 100 sec bins |
 |
|
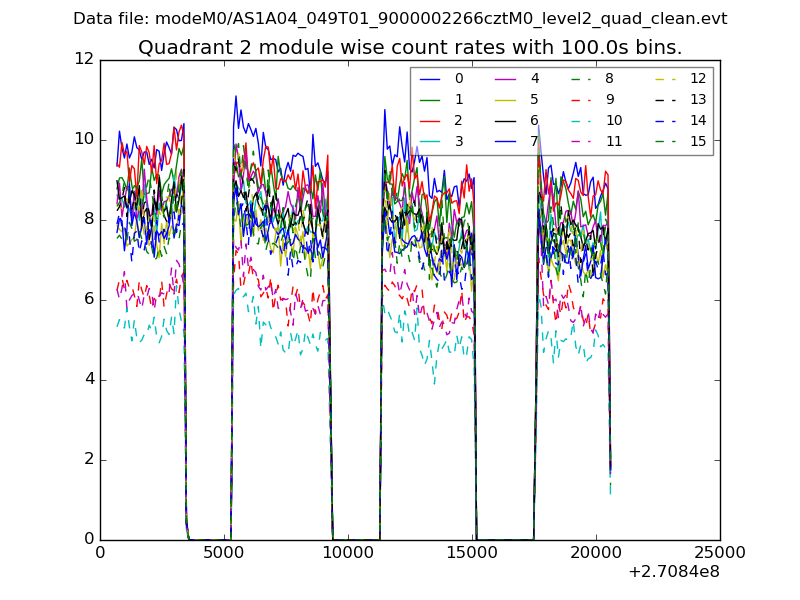
| Module-wise count rates for Quadrant A Data is divided into 100 sec bins |
 |
 |
| Module-wise count rates for Quadrant B Data is divided into 100 sec bins |
 |
 |
| Module-wise count rates for Quadrant C Data is divided into 100 sec bins |
 |
 |
| Module-wise count rates for Quadrant D Data is divided into 100 sec bins |
 |
 |
| Parameter | Plot |
|---|---|
| CZT HV Monitor | 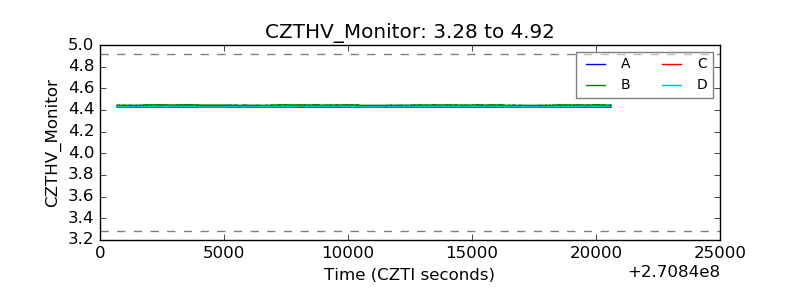 |
| D_VDD |  |
| Temperature 1 |  |
| Veto HV Monitor | 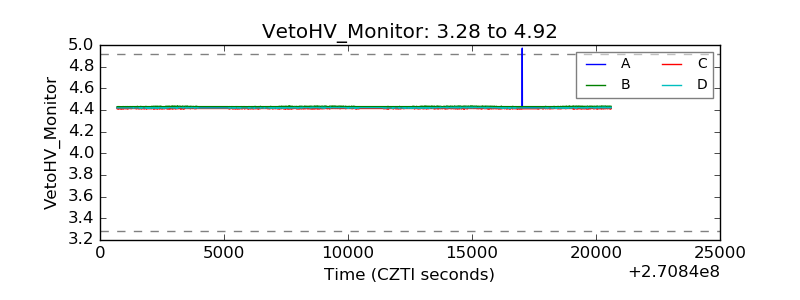 |
| Veto LLD |  |
| Alpha Counter |  |
| _CPM_Rate |  |
| CZT Counter | 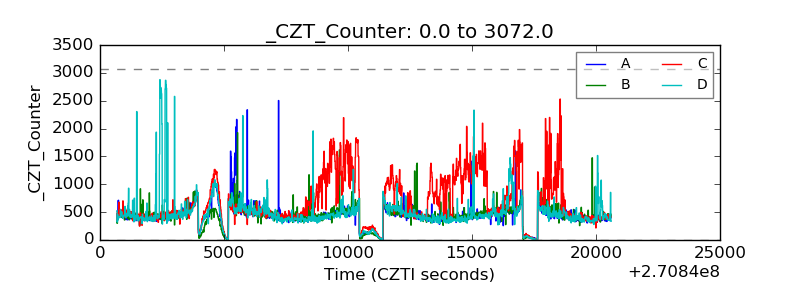 |
| +2.5 Volts monitor |  |
| +5 Volts monitor |  |
| _ROLL_ROT |  |
| _Roll_DEC |  |
| _Roll_RA |  |
| Veto Counter |  |