| Param | Original file | Final file |
|---|---|---|
| Filename | modeM0/AS1T02_073T01_9000002260cztM0_level2_bc.evt | modeM0/AS1T02_073T01_9000002260cztM0_level2_quad_clean.evt |
| Size (bytes) | 7,308,797,760 | 2,801,390,400 |
| Size | 6.8 GB | 2.6 GB |
| Events in quadrant A | 44,859,396 | 17,873,275 |
| Events in quadrant B | 44,743,481 | 18,227,033 |
| Events in quadrant C | 50,273,752 | 17,899,448 |
| Events in quadrant D | 67,462,629 | 16,763,823 |
| Mode M9 | |||
|---|---|---|---|
| Quadrant | BADHDUFLAG | Total packets | Discarded packets |
| A | 0 | 340 | 0 |
| B | 0 | 340 | 0 |
| C | 0 | 340 | 0 |
| D | 0 | 341 | 0 |
| Mode M0 | |||
|---|---|---|---|
| Quadrant | BADHDUFLAG | Total packets | Discarded packets |
| A | 0 | 439092 | 0 |
| B | 0 | 434781 | 0 |
| C | 0 | 441334 | 0 |
| D | 0 | 527786 | 0 |
| Mode SS | |||
|---|---|---|---|
| Quadrant | BADHDUFLAG | Total packets | Discarded packets |
| A | 0 | 4190 | 0 |
| B | 0 | 4190 | 0 |
| C | 0 | 4190 | 0 |
| D | 0 | 4190 | 0 |
| Quadrant | Total seconds | Saturated seconds | Saturation percentage |
|---|---|---|---|
| A | 205716 | 4027 | 1.957553% |
| B | 205716 | 3042 | 1.478738% |
| C | 205716 | 2081 | 1.011589% |
| D | 205716 | 11468 | 5.574676% |
Noise dominated data is calculated using 1-second bins in cleaned event files. If a bin has >2000 counts, and if more than 50% of those come from <1% of pixels, then it is considered to be noise-dominated and hence unusable.
| Quadrant | # 1 sec bins | Bins with >0 counts | Bins with >2000 counts | High rate bins dominated by noise | Noise dominated (total time) | Noise dominated (detector-on time) | Marked lightcurve |
|---|---|---|---|---|---|---|---|
| A | 244643 | 205706 | 43 | 43 | 0.02% | 0.02% |  |
| B | 244643 | 205697 | 50 | 50 | 0.02% | 0.02% |  |
| C | 244643 | 205704 | 15 | 15 | 0.01% | 0.01% | 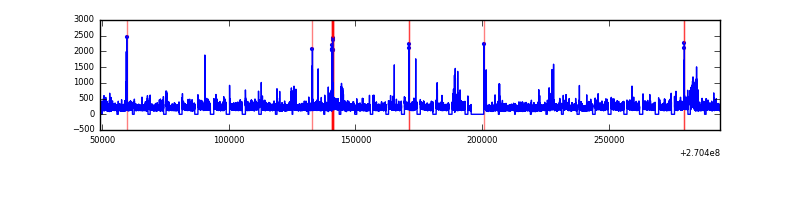 |
| D | 244643 | 205699 | 1590 | 1590 | 0.65% | 0.77% |  |
Top three noisy pixels from each quadrant. If the there are fewer than three noisy pixels in the level2.evt file, extra rows are filled as -1
| Pixel properties | Quadrant properties | ||||||
|---|---|---|---|---|---|---|---|
| Quadrant | DetID | PixID | Counts | Sigma | Mean | Median | Sigma |
| A | 15 | 239 | 3009679 | 1292.51 | 10747 | 10556 | 2320.4 |
| A | 9 | 143 | 252842 | 104.42 | 10747 | 10556 | 2320.4 |
| A | 2 | 79 | 157292 | 63.24 | 10747 | 10556 | 2320.4 |
| B | 10 | 16 | 1097313 | 532.52 | 10893 | 10616 | 2040.7 |
| B | 4 | 173 | 442693 | 211.73 | 10893 | 10616 | 2040.7 |
| B | 3 | 64 | 345185 | 163.95 | 10893 | 10616 | 2040.7 |
| C | 3 | 233 | 7713107 | 3313.18 | 10639 | 10516 | 2324.8 |
| C | 7 | 247 | 749969 | 318.07 | 10639 | 10516 | 2324.8 |
| C | 4 | 254 | 109662 | 42.65 | 10639 | 10516 | 2324.8 |
| D | 13 | 122 | 14523778 | 6043.5 | 10455 | 10104 | 2401.5 |
| D | 1 | 255 | 5159126 | 2144.05 | 10455 | 10104 | 2401.5 |
| D | 2 | 33 | 3432509 | 1425.09 | 10455 | 10104 | 2401.5 |
Histogram calculated using DETX and DETY for each event in the final _common_clean file
| Quadrant A | 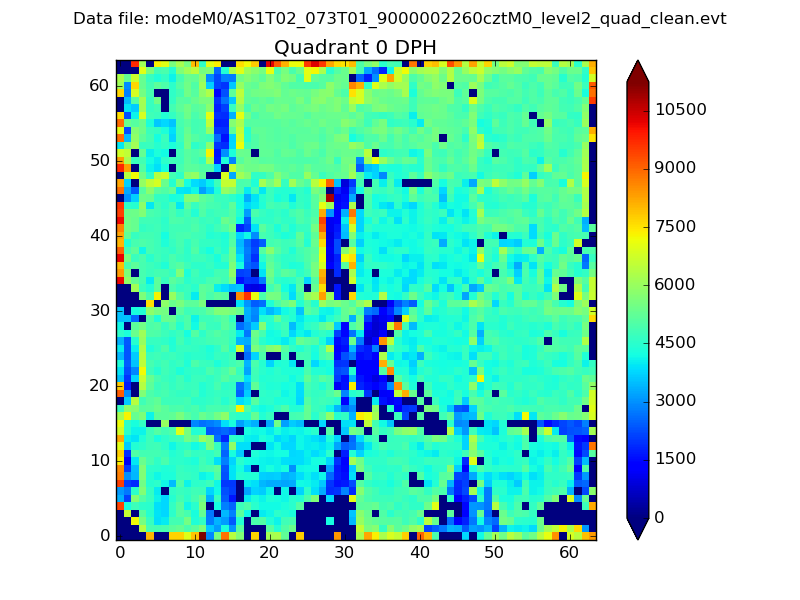 |
 |
Quadrant B |
|---|---|---|---|
| Quadrant D |  |
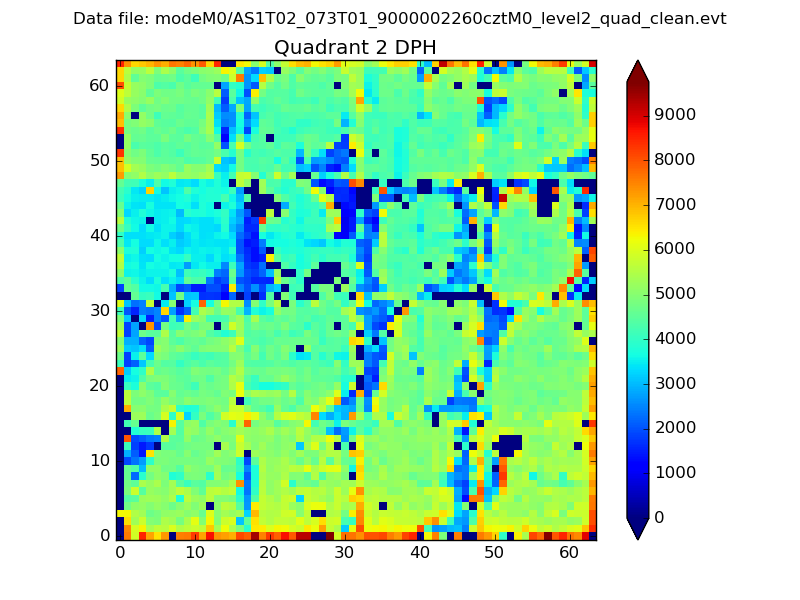 |
Quadrant C |
| Plot type | Count rate plots | Images |
|---|---|---|
| Comparison with Poisson distribution Blue bars denote a histogram of data divided into 1 sec bins. Red curve is a Poisson curve with rate = median count rate of data. |
 |
 |
| Quadrant-wise count rates Data is divided into 100 sec bins |
 |
|
| Module-wise count rates for Quadrant A Data is divided into 100 sec bins |
 |
 |
| Module-wise count rates for Quadrant B Data is divided into 100 sec bins |
 |
 |
| Module-wise count rates for Quadrant C Data is divided into 100 sec bins |
 |
 |
| Module-wise count rates for Quadrant D Data is divided into 100 sec bins |
 |
 |
| Parameter | Plot |
|---|---|
| CZT HV Monitor |  |
| D_VDD |  |
| Temperature 1 |  |
| Veto HV Monitor |  |
| Veto LLD | 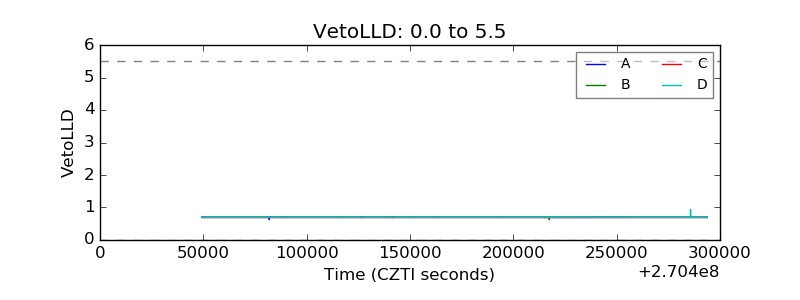 |
| Alpha Counter | 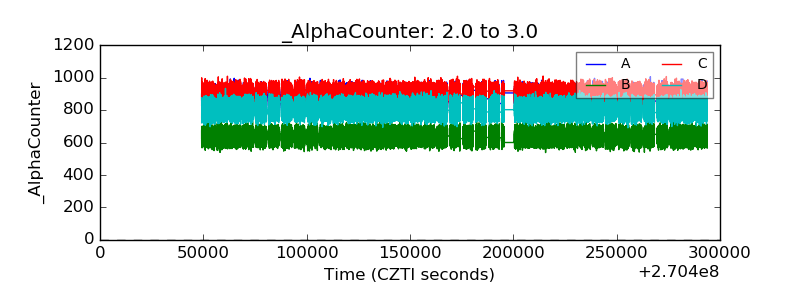 |
| _CPM_Rate |  |
| CZT Counter |  |
| +2.5 Volts monitor |  |
| +5 Volts monitor |  |
| _ROLL_ROT |  |
| _Roll_DEC | 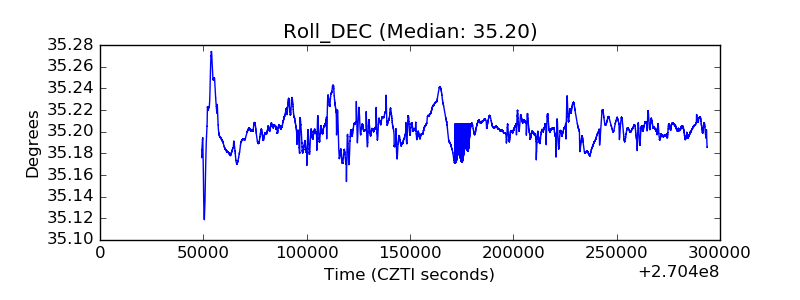 |
| _Roll_RA |  |
| Veto Counter |  |