| Param | Original file | Final file |
|---|---|---|
| Filename | modeM0/AS1G08_037T01_9000002256cztM0_level2_bc.evt | modeM0/AS1G08_037T01_9000002256cztM0_level2_quad_clean.evt |
| Size (bytes) | 1,064,946,240 | 451,661,760 |
| Size | 1015.6 MB | 430.7 MB |
| Events in quadrant A | 6,710,962 | 2,964,392 |
| Events in quadrant B | 9,419,502 | 2,955,943 |
| Events in quadrant C | 7,296,339 | 2,908,015 |
| Events in quadrant D | 6,773,150 | 2,788,549 |
| Mode SS | |||
|---|---|---|---|
| Quadrant | BADHDUFLAG | Total packets | Discarded packets |
| A | 0 | 614 | 0 |
| B | 0 | 614 | 0 |
| C | 0 | 614 | 0 |
| D | 0 | 614 | 0 |
| Mode M0 | |||
|---|---|---|---|
| Quadrant | BADHDUFLAG | Total packets | Discarded packets |
| A | 0 | 63885 | 0 |
| B | 0 | 73598 | 0 |
| C | 0 | 63955 | 0 |
| D | 0 | 63904 | 0 |
| Mode M9 | |||
|---|---|---|---|
| Quadrant | BADHDUFLAG | Total packets | Discarded packets |
| A | 0 | 61 | 0 |
| B | 0 | 61 | 0 |
| C | 0 | 61 | 0 |
| D | 0 | 61 | 0 |
| Quadrant | Total seconds | Saturated seconds | Saturation percentage |
|---|---|---|---|
| A | 30033 | 435 | 1.448407% |
| B | 30033 | 1212 | 4.035561% |
| C | 30033 | 338 | 1.125429% |
| D | 30033 | 466 | 1.551627% |
Noise dominated data is calculated using 1-second bins in cleaned event files. If a bin has >2000 counts, and if more than 50% of those come from <1% of pixels, then it is considered to be noise-dominated and hence unusable.
| Quadrant | # 1 sec bins | Bins with >0 counts | Bins with >2000 counts | High rate bins dominated by noise | Noise dominated (total time) | Noise dominated (detector-on time) | Marked lightcurve |
|---|---|---|---|---|---|---|---|
| A | 36169 | 30030 | 0 | 0 | 0.00% | 0.00% |  |
| B | 36169 | 30028 | 139 | 139 | 0.38% | 0.46% |  |
| C | 36169 | 30030 | 0 | 0 | 0.00% | 0.00% | 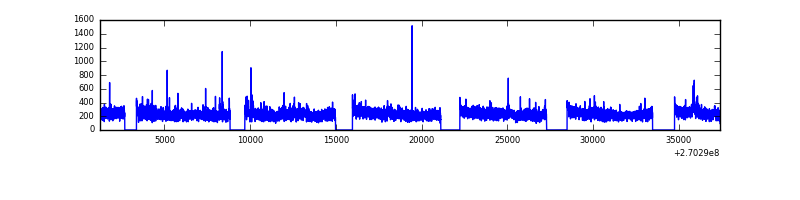 |
| D | 36169 | 30028 | 15 | 15 | 0.04% | 0.05% |  |
Top three noisy pixels from each quadrant. If the there are fewer than three noisy pixels in the level2.evt file, extra rows are filled as -1
| Pixel properties | Quadrant properties | ||||||
|---|---|---|---|---|---|---|---|
| Quadrant | DetID | PixID | Counts | Sigma | Mean | Median | Sigma |
| A | 12 | 189 | 288592 | 807.61 | 1633 | 1602 | 355.4 |
| A | 9 | 143 | 91102 | 251.86 | 1633 | 1602 | 355.4 |
| A | 12 | 30 | 31126 | 83.08 | 1633 | 1602 | 355.4 |
| B | 10 | 16 | 2073707 | 6745.71 | 1619 | 1576 | 307.2 |
| B | 0 | 85 | 179594 | 579.53 | 1619 | 1576 | 307.2 |
| B | 0 | 219 | 164693 | 531.02 | 1619 | 1576 | 307.2 |
| C | 3 | 233 | 1059235 | 3081.44 | 1578 | 1560 | 343.2 |
| C | 7 | 247 | 53060 | 150.04 | 1578 | 1560 | 343.2 |
| C | 10 | 22 | 10126 | 24.96 | 1578 | 1560 | 343.2 |
| D | 2 | 33 | 127086 | 346.51 | 1592 | 1538 | 362.3 |
| D | 2 | 234 | 112564 | 306.43 | 1592 | 1538 | 362.3 |
| D | 7 | 38 | 106924 | 290.86 | 1592 | 1538 | 362.3 |
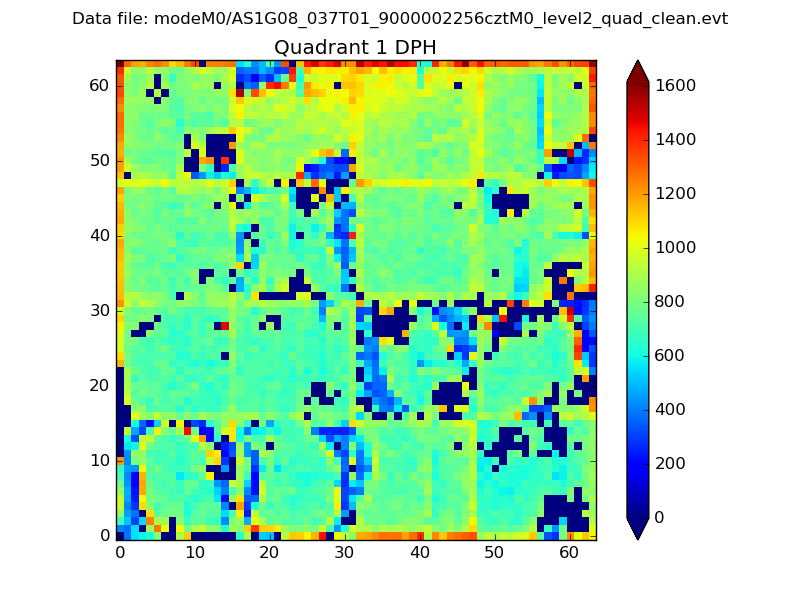
Histogram calculated using DETX and DETY for each event in the final _common_clean file
| Quadrant A |  |
 |
Quadrant B |
|---|---|---|---|
| Quadrant D |  |
 |
Quadrant C |
| Plot type | Count rate plots | Images |
|---|---|---|
| Comparison with Poisson distribution Blue bars denote a histogram of data divided into 1 sec bins. Red curve is a Poisson curve with rate = median count rate of data. |
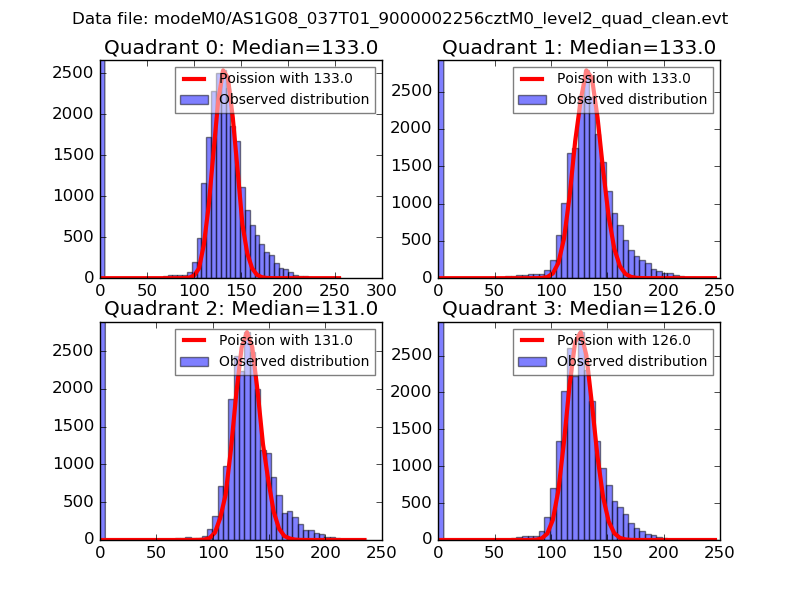 |
 |
| Quadrant-wise count rates Data is divided into 100 sec bins |
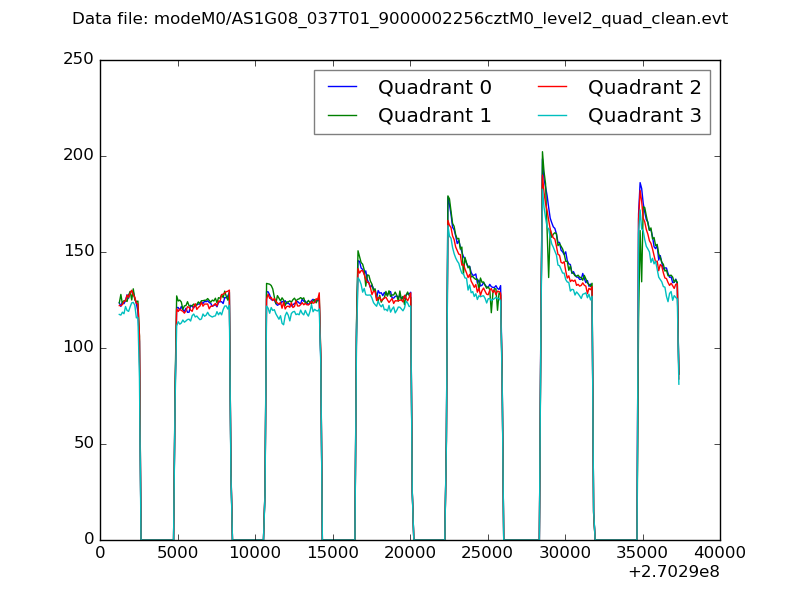 |
|
| Module-wise count rates for Quadrant A Data is divided into 100 sec bins |
 |
 |
| Module-wise count rates for Quadrant B Data is divided into 100 sec bins |
 |
 |
| Module-wise count rates for Quadrant C Data is divided into 100 sec bins |
 |
 |
| Module-wise count rates for Quadrant D Data is divided into 100 sec bins |
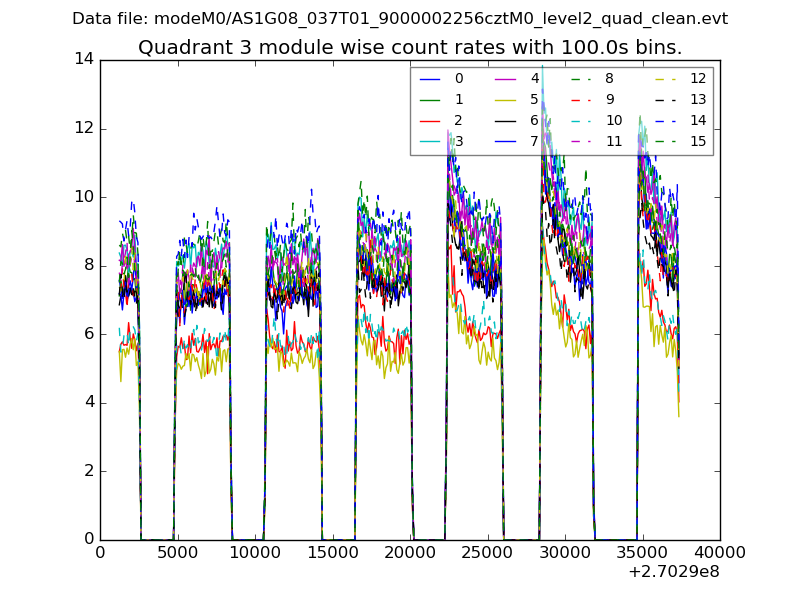 |
 |
| Parameter | Plot |
|---|---|
| CZT HV Monitor |  |
| D_VDD |  |
| Temperature 1 |  |
| Veto HV Monitor | 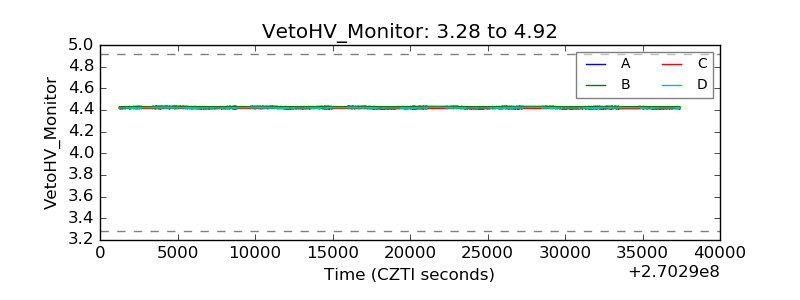 |
| Veto LLD |  |
| Alpha Counter |  |
| _CPM_Rate | 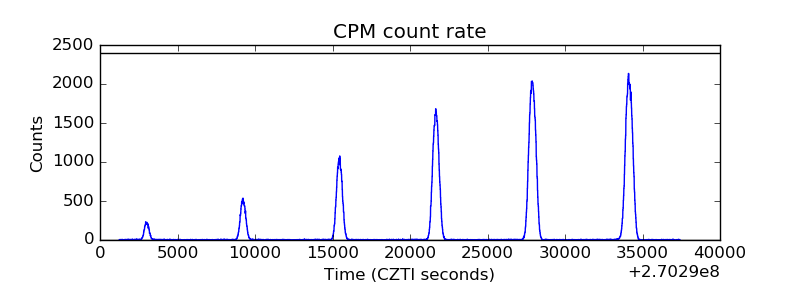 |
| CZT Counter |  |
| +2.5 Volts monitor |  |
| +5 Volts monitor | 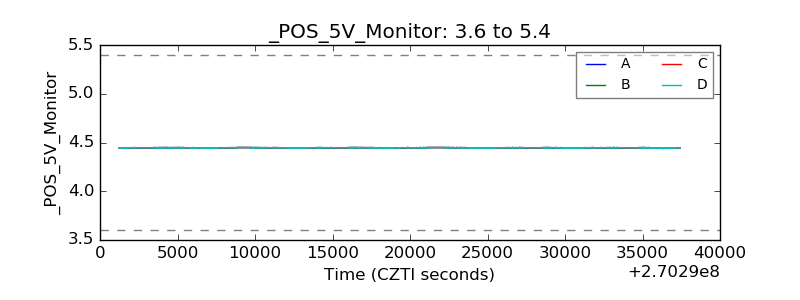 |
| _ROLL_ROT |  |
| _Roll_DEC |  |
| _Roll_RA | 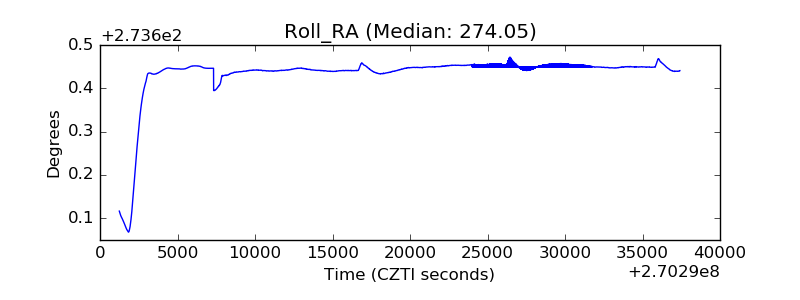 |
| Veto Counter | 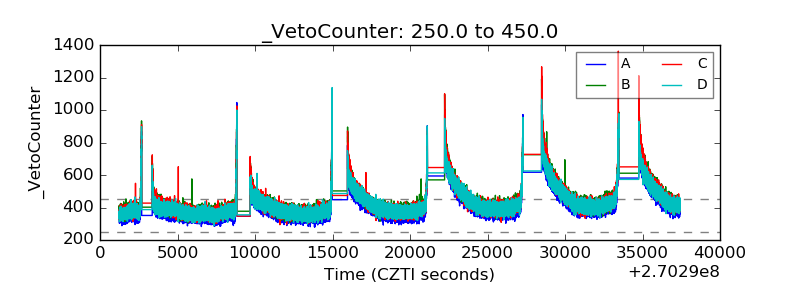 |