| Param | Original file | Final file |
|---|---|---|
| Filename | modeM0/AS1A04_223T01_9000002258cztM0_level2_bc.evt | modeM0/AS1A04_223T01_9000002258cztM0_level2_quad_clean.evt |
| Size (bytes) | 3,502,840,320 | 1,323,564,480 |
| Size | 3.3 GB | 1.2 GB |
| Events in quadrant A | 21,190,873 | 8,382,812 |
| Events in quadrant B | 28,367,876 | 8,435,814 |
| Events in quadrant C | 25,891,359 | 8,263,264 |
| Events in quadrant D | 23,548,196 | 7,882,519 |
| Mode M9 | |||
|---|---|---|---|
| Quadrant | BADHDUFLAG | Total packets | Discarded packets |
| A | 0 | 162 | 0 |
| B | 0 | 162 | 0 |
| C | 0 | 162 | 0 |
| D | 0 | 162 | 0 |
| Mode M0 | |||
|---|---|---|---|
| Quadrant | BADHDUFLAG | Total packets | Discarded packets |
| A | 0 | 216278 | 0 |
| B | 0 | 242986 | 0 |
| C | 0 | 225691 | 0 |
| D | 0 | 222832 | 0 |
| Mode SS | |||
|---|---|---|---|
| Quadrant | BADHDUFLAG | Total packets | Discarded packets |
| A | 0 | 2126 | 0 |
| B | 0 | 2126 | 0 |
| C | 0 | 2126 | 0 |
| D | 0 | 2126 | 0 |
| Quadrant | Total seconds | Saturated seconds | Saturation percentage |
|---|---|---|---|
| A | 103959 | 1035 | 0.995585% |
| B | 103959 | 3424 | 3.293606% |
| C | 103959 | 1063 | 1.022518% |
| D | 103959 | 1297 | 1.247607% |
Noise dominated data is calculated using 1-second bins in cleaned event files. If a bin has >2000 counts, and if more than 50% of those come from <1% of pixels, then it is considered to be noise-dominated and hence unusable.
| Quadrant | # 1 sec bins | Bins with >0 counts | Bins with >2000 counts | High rate bins dominated by noise | Noise dominated (total time) | Noise dominated (detector-on time) | Marked lightcurve |
|---|---|---|---|---|---|---|---|
| A | 120545 | 103954 | 7 | 7 | 0.01% | 0.01% |  |
| B | 120545 | 103956 | 234 | 234 | 0.19% | 0.23% |  |
| C | 120545 | 103958 | 8 | 8 | 0.01% | 0.01% |  |
| D | 120545 | 103956 | 139 | 139 | 0.12% | 0.13% | 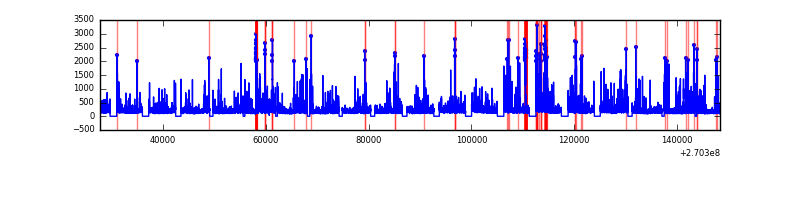 |
Top three noisy pixels from each quadrant. If the there are fewer than three noisy pixels in the level2.evt file, extra rows are filled as -1
| Pixel properties | Quadrant properties | ||||||
|---|---|---|---|---|---|---|---|
| Quadrant | DetID | PixID | Counts | Sigma | Mean | Median | Sigma |
| A | 9 | 143 | 281065 | 234.96 | 5413 | 5312 | 1173.6 |
| A | 15 | 69 | 78375 | 62.26 | 5413 | 5312 | 1173.6 |
| A | 13 | 252 | 39331 | 28.99 | 5413 | 5312 | 1173.6 |
| B | 10 | 16 | 4797104 | 4715.42 | 5402 | 5255 | 1016.2 |
| B | 3 | 64 | 530982 | 517.34 | 5402 | 5255 | 1016.2 |
| B | 0 | 229 | 314230 | 304.05 | 5402 | 5255 | 1016.2 |
| C | 3 | 233 | 4295812 | 3740.07 | 5251 | 5180 | 1147.2 |
| C | 4 | 254 | 654521 | 566.02 | 5251 | 5180 | 1147.2 |
| C | 3 | 9 | 258074 | 220.44 | 5251 | 5180 | 1147.2 |
| D | 2 | 33 | 949431 | 779.08 | 5280 | 5095 | 1212.1 |
| D | 7 | 38 | 619121 | 506.57 | 5280 | 5095 | 1212.1 |
| D | 2 | 234 | 393608 | 320.52 | 5280 | 5095 | 1212.1 |
Histogram calculated using DETX and DETY for each event in the final _common_clean file
| Quadrant A |  |
 |
Quadrant B |
|---|---|---|---|
| Quadrant D |  |
 |
Quadrant C |
| Plot type | Count rate plots | Images |
|---|---|---|
| Comparison with Poisson distribution Blue bars denote a histogram of data divided into 1 sec bins. Red curve is a Poisson curve with rate = median count rate of data. |
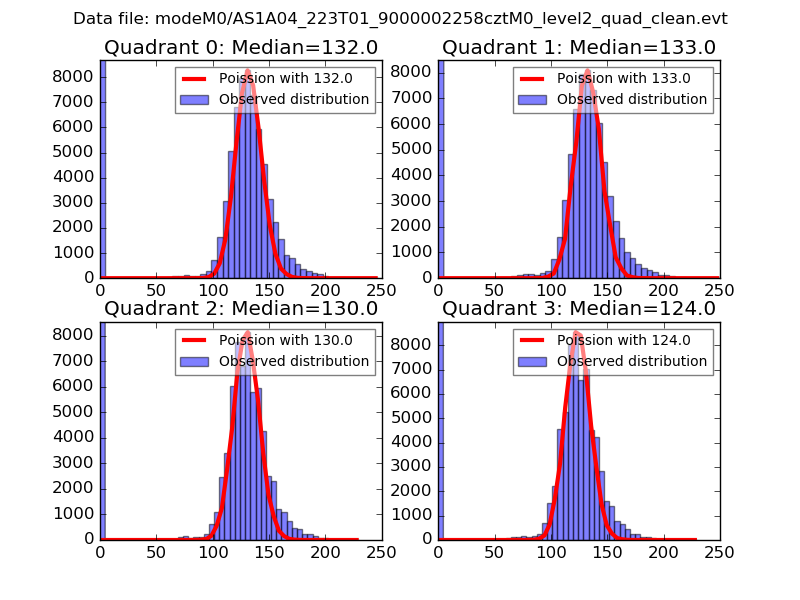 |
 |
| Quadrant-wise count rates Data is divided into 100 sec bins |
 |
|
| Module-wise count rates for Quadrant A Data is divided into 100 sec bins |
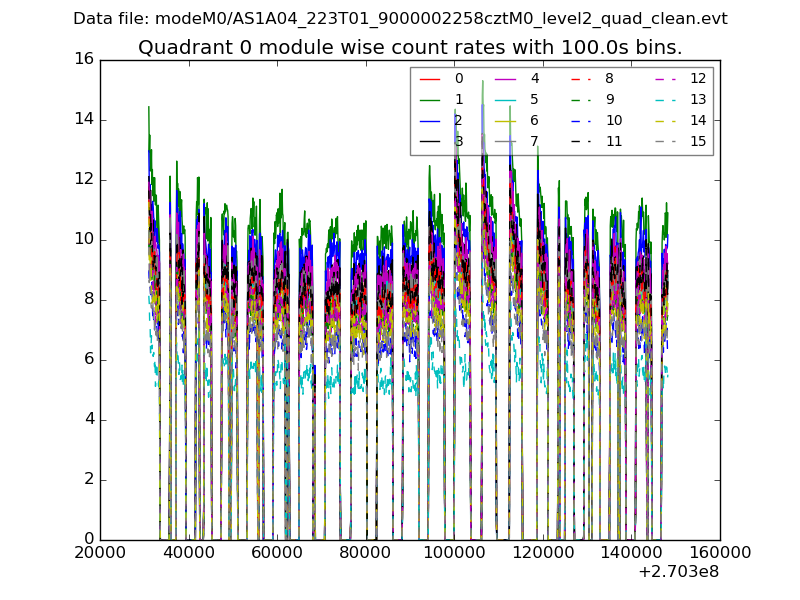 |
 |
| Module-wise count rates for Quadrant B Data is divided into 100 sec bins |
 |
 |
| Module-wise count rates for Quadrant C Data is divided into 100 sec bins |
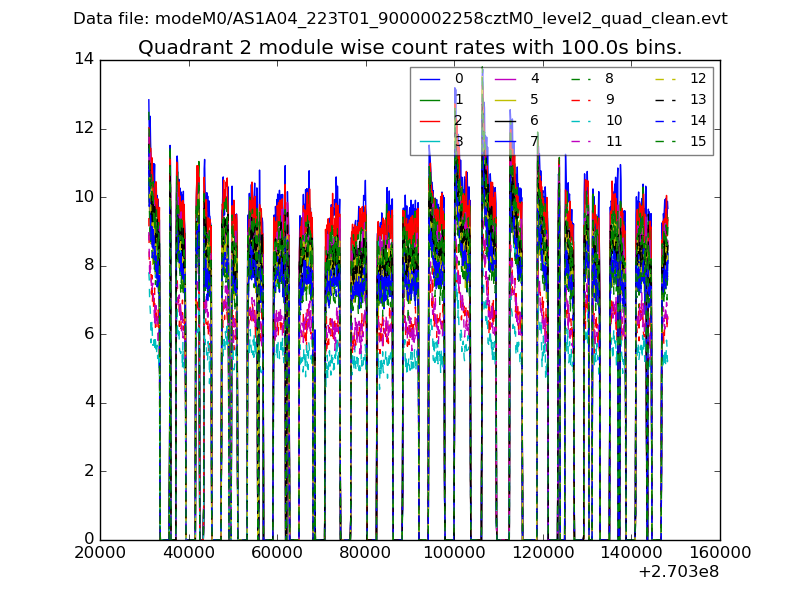 |
 |
| Module-wise count rates for Quadrant D Data is divided into 100 sec bins |
 |
 |
| Parameter | Plot |
|---|---|
| CZT HV Monitor |  |
| D_VDD |  |
| Temperature 1 | 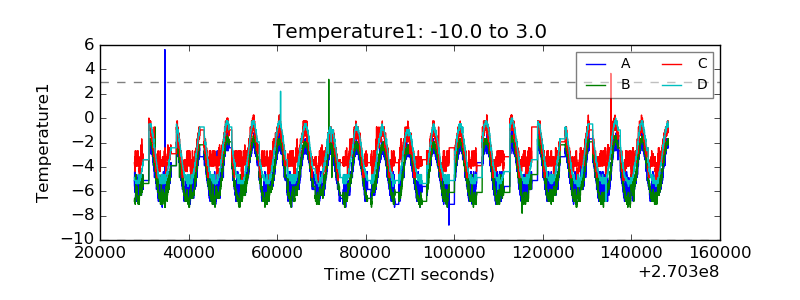 |
| Veto HV Monitor |  |
| Veto LLD |  |
| Alpha Counter |  |
| _CPM_Rate | 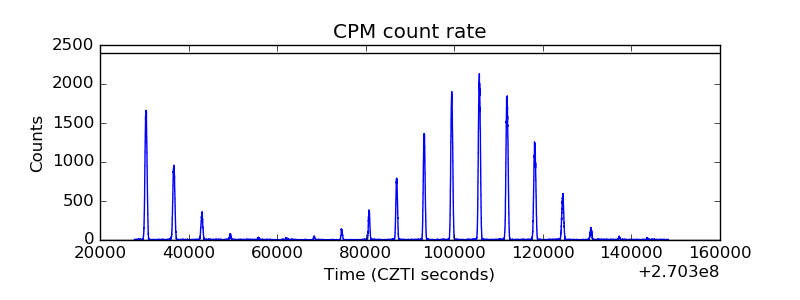 |
| CZT Counter |  |
| +2.5 Volts monitor |  |
| +5 Volts monitor | 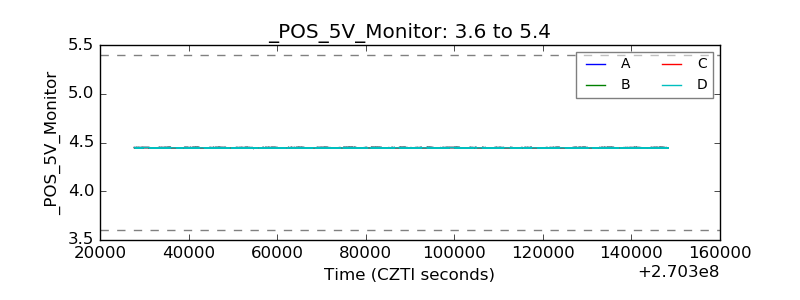 |
| _ROLL_ROT |  |
| _Roll_DEC | 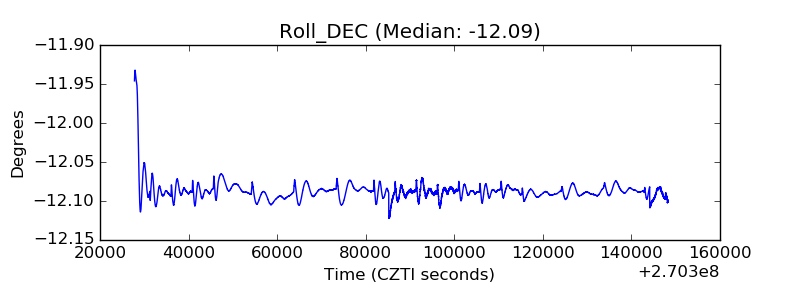 |
| _Roll_RA | 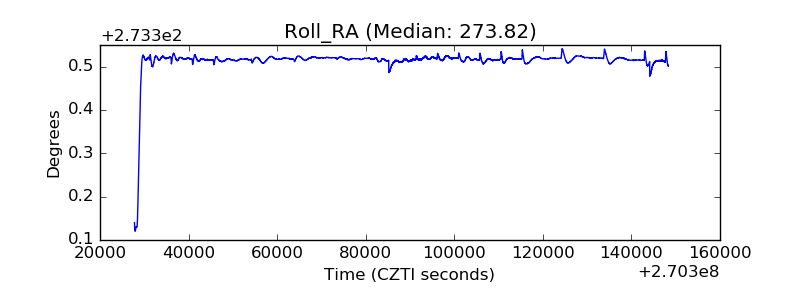 |
| Veto Counter |  |