| Param | Original file | Final file |
|---|---|---|
| Filename | modeM0/AS1A04_207T01_9000002254cztM0_level2_bc.evt | modeM0/AS1A04_207T01_9000002254cztM0_level2_quad_clean.evt |
| Size (bytes) | 3,416,932,800 | 1,247,641,920 |
| Size | 3.2 GB | 1.2 GB |
| Events in quadrant A | 21,222,902 | 7,923,583 |
| Events in quadrant B | 25,700,016 | 7,917,503 |
| Events in quadrant C | 26,221,961 | 7,899,004 |
| Events in quadrant D | 23,866,948 | 7,539,197 |
| Mode SS | |||
|---|---|---|---|
| Quadrant | BADHDUFLAG | Total packets | Discarded packets |
| A | 0 | 1936 | 0 |
| B | 0 | 1936 | 0 |
| C | 0 | 1936 | 0 |
| D | 0 | 1936 | 0 |
| Mode M9 | |||
|---|---|---|---|
| Quadrant | BADHDUFLAG | Total packets | Discarded packets |
| A | 0 | 131 | 0 |
| B | 0 | 131 | 0 |
| C | 0 | 131 | 0 |
| D | 0 | 131 | 0 |
| Mode M0 | |||
|---|---|---|---|
| Quadrant | BADHDUFLAG | Total packets | Discarded packets |
| A | 0 | 201771 | 0 |
| B | 0 | 217834 | 0 |
| C | 0 | 213276 | 0 |
| D | 0 | 212018 | 0 |
| Quadrant | Total seconds | Saturated seconds | Saturation percentage |
|---|---|---|---|
| A | 94998 | 966 | 1.016864% |
| B | 95001 | 2481 | 2.611551% |
| C | 95001 | 824 | 0.867359% |
| D | 95000 | 1848 | 1.945263% |
Noise dominated data is calculated using 1-second bins in cleaned event files. If a bin has >2000 counts, and if more than 50% of those come from <1% of pixels, then it is considered to be noise-dominated and hence unusable.
| Quadrant | # 1 sec bins | Bins with >0 counts | Bins with >2000 counts | High rate bins dominated by noise | Noise dominated (total time) | Noise dominated (detector-on time) | Marked lightcurve |
|---|---|---|---|---|---|---|---|
| A | 108204 | 94989 | 11 | 11 | 0.01% | 0.01% |  |
| B | 108204 | 94989 | 287 | 287 | 0.27% | 0.30% |  |
| C | 108204 | 94994 | 11 | 11 | 0.01% | 0.01% |  |
| D | 108204 | 94991 | 333 | 333 | 0.31% | 0.35% |  |
Top three noisy pixels from each quadrant. If the there are fewer than three noisy pixels in the level2.evt file, extra rows are filled as -1
| Pixel properties | Quadrant properties | ||||||
|---|---|---|---|---|---|---|---|
| Quadrant | DetID | PixID | Counts | Sigma | Mean | Median | Sigma |
| A | 12 | 189 | 1741662 | 1632.99 | 4867 | 4766 | 1063.6 |
| A | 9 | 143 | 446222 | 415.05 | 4867 | 4766 | 1063.6 |
| A | 13 | 248 | 78697 | 69.51 | 4867 | 4766 | 1063.6 |
| B | 3 | 64 | 1973528 | 2134.73 | 4888 | 4751 | 922.3 |
| B | 10 | 16 | 1966062 | 2126.63 | 4888 | 4751 | 922.3 |
| B | 0 | 219 | 650967 | 700.69 | 4888 | 4751 | 922.3 |
| C | 3 | 233 | 6601393 | 6312.6 | 4752 | 4685 | 1045.0 |
| C | 3 | 9 | 611293 | 580.48 | 4752 | 4685 | 1045.0 |
| C | 4 | 254 | 358292 | 338.38 | 4752 | 4685 | 1045.0 |
| D | 2 | 33 | 1791087 | 1627.94 | 4753 | 4580 | 1097.4 |
| D | 13 | 172 | 1176990 | 1068.35 | 4753 | 4580 | 1097.4 |
| D | 7 | 38 | 838478 | 759.88 | 4753 | 4580 | 1097.4 |
Histogram calculated using DETX and DETY for each event in the final _common_clean file
| Quadrant A | 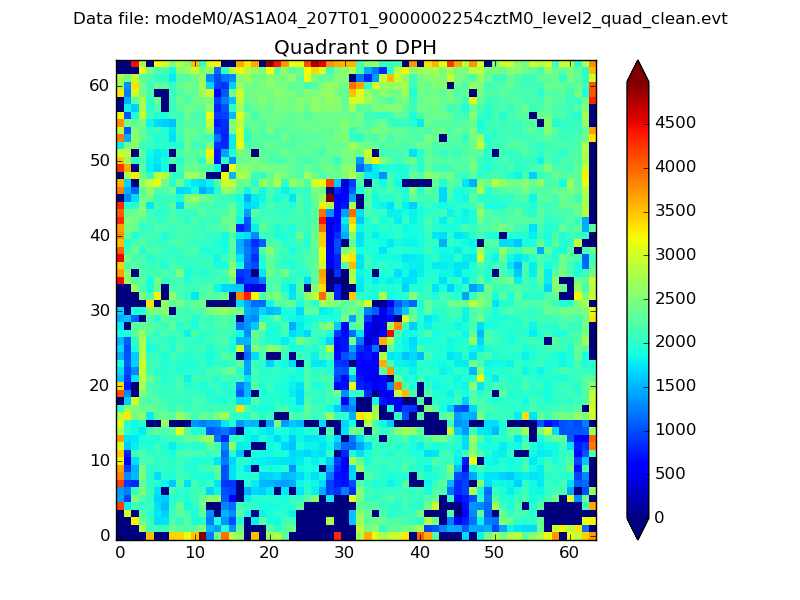 |
 |
Quadrant B |
|---|---|---|---|
| Quadrant D |  |
 |
Quadrant C |
| Plot type | Count rate plots | Images |
|---|---|---|
| Comparison with Poisson distribution Blue bars denote a histogram of data divided into 1 sec bins. Red curve is a Poisson curve with rate = median count rate of data. |
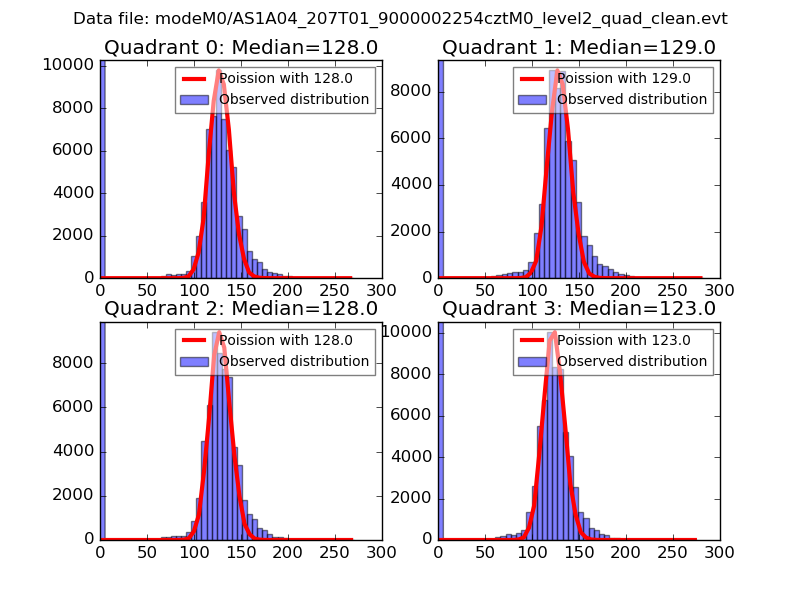 |
 |
| Quadrant-wise count rates Data is divided into 100 sec bins |
 |
|
| Module-wise count rates for Quadrant A Data is divided into 100 sec bins |
 |
 |
| Module-wise count rates for Quadrant B Data is divided into 100 sec bins |
 |
 |
| Module-wise count rates for Quadrant C Data is divided into 100 sec bins |
 |
 |
| Module-wise count rates for Quadrant D Data is divided into 100 sec bins |
 |
 |
| Parameter | Plot |
|---|---|
| CZT HV Monitor |  |
| D_VDD |  |
| Temperature 1 | 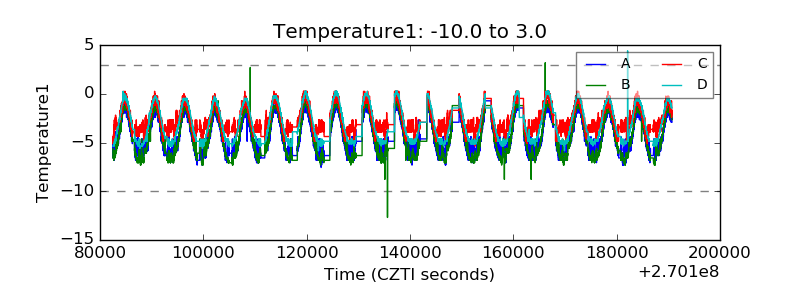 |
| Veto HV Monitor |  |
| Veto LLD |  |
| Alpha Counter | 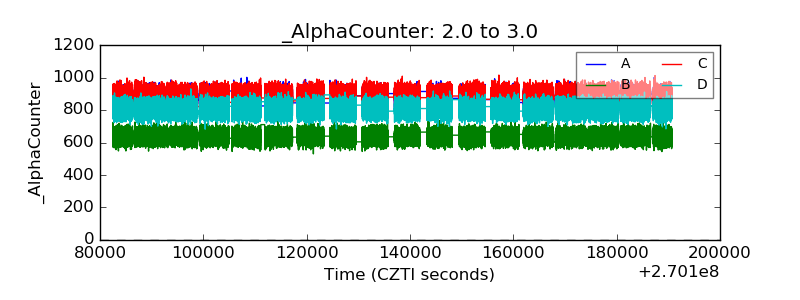 |
| _CPM_Rate |  |
| CZT Counter |  |
| +2.5 Volts monitor |  |
| +5 Volts monitor |  |
| _ROLL_ROT |  |
| _Roll_DEC |  |
| _Roll_RA |  |
| Veto Counter |  |