| Param | Original file | Final file |
|---|---|---|
| Filename | modeM0/AS1T02_073T01_9000002252cztM0_level2_bc.evt | modeM0/AS1T02_073T01_9000002252cztM0_level2_quad_clean.evt |
| Size (bytes) | 1,801,105,920 | 738,241,920 |
| Size | 1.7 GB | 704.0 MB |
| Events in quadrant A | 11,673,341 | 4,728,133 |
| Events in quadrant B | 13,614,474 | 4,787,065 |
| Events in quadrant C | 13,860,878 | 4,702,058 |
| Events in quadrant D | 11,796,685 | 4,521,866 |
| Mode M9 | |||
|---|---|---|---|
| Quadrant | BADHDUFLAG | Total packets | Discarded packets |
| A | 0 | 106 | 0 |
| B | 0 | 106 | 0 |
| C | 0 | 106 | 0 |
| D | 0 | 106 | 0 |
| Mode M0 | |||
|---|---|---|---|
| Quadrant | BADHDUFLAG | Total packets | Discarded packets |
| A | 0 | 111230 | 0 |
| B | 0 | 118703 | 0 |
| C | 0 | 115636 | 0 |
| D | 0 | 112277 | 0 |
| Mode SS | |||
|---|---|---|---|
| Quadrant | BADHDUFLAG | Total packets | Discarded packets |
| A | 0 | 1076 | 0 |
| B | 0 | 1076 | 0 |
| C | 0 | 1076 | 0 |
| D | 0 | 1076 | 0 |
| Quadrant | Total seconds | Saturated seconds | Saturation percentage |
|---|---|---|---|
| A | 52804 | 459 | 0.869252% |
| B | 52804 | 1244 | 2.355882% |
| C | 52804 | 626 | 1.185516% |
| D | 52804 | 519 | 0.982880% |
Noise dominated data is calculated using 1-second bins in cleaned event files. If a bin has >2000 counts, and if more than 50% of those come from <1% of pixels, then it is considered to be noise-dominated and hence unusable.
| Quadrant | # 1 sec bins | Bins with >0 counts | Bins with >2000 counts | High rate bins dominated by noise | Noise dominated (total time) | Noise dominated (detector-on time) | Marked lightcurve |
|---|---|---|---|---|---|---|---|
| A | 63396 | 52802 | 2 | 2 | 0.00% | 0.00% | 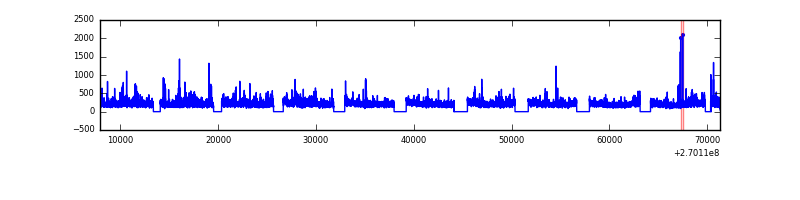 |
| B | 63396 | 52804 | 153 | 153 | 0.24% | 0.29% |  |
| C | 63396 | 52801 | 28 | 28 | 0.04% | 0.05% |  |
| D | 63396 | 52803 | 28 | 28 | 0.04% | 0.05% | 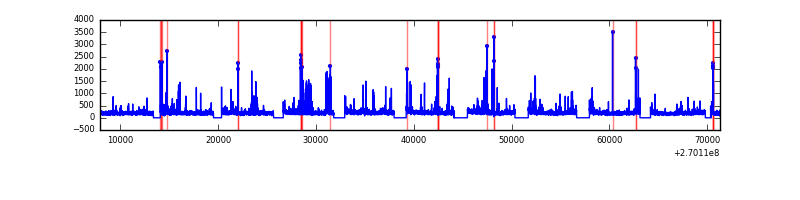 |
Top three noisy pixels from each quadrant. If the there are fewer than three noisy pixels in the level2.evt file, extra rows are filled as -1
| Pixel properties | Quadrant properties | ||||||
|---|---|---|---|---|---|---|---|
| Quadrant | DetID | PixID | Counts | Sigma | Mean | Median | Sigma |
| A | 12 | 189 | 831351 | 1365.78 | 2805 | 2750 | 606.7 |
| A | 9 | 143 | 44217 | 68.35 | 2805 | 2750 | 606.7 |
| A | 15 | 69 | 19034 | 26.84 | 2805 | 2750 | 606.7 |
| B | 10 | 16 | 1729707 | 3210.78 | 2838 | 2764 | 537.9 |
| B | 10 | 245 | 268853 | 494.72 | 2838 | 2764 | 537.9 |
| B | 3 | 64 | 218778 | 401.62 | 2838 | 2764 | 537.9 |
| C | 3 | 233 | 2688467 | 4388.79 | 2771 | 2735 | 612.0 |
| C | 4 | 254 | 202926 | 327.14 | 2771 | 2735 | 612.0 |
| C | 14 | 234 | 67513 | 105.85 | 2771 | 2735 | 612.0 |
| D | 10 | 70 | 371761 | 579.81 | 2775 | 2678 | 636.6 |
| D | 2 | 33 | 244822 | 380.39 | 2775 | 2678 | 636.6 |
| D | 2 | 234 | 185124 | 286.61 | 2775 | 2678 | 636.6 |
Histogram calculated using DETX and DETY for each event in the final _common_clean file
| Quadrant A |  |
 |
Quadrant B |
|---|---|---|---|
| Quadrant D | 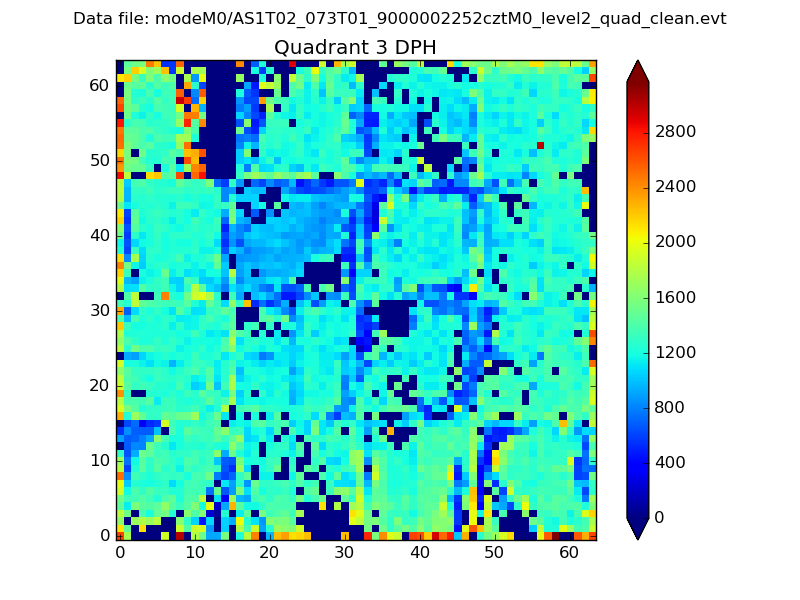 |
 |
Quadrant C |
| Plot type | Count rate plots | Images |
|---|---|---|
| Comparison with Poisson distribution Blue bars denote a histogram of data divided into 1 sec bins. Red curve is a Poisson curve with rate = median count rate of data. |
 |
 |
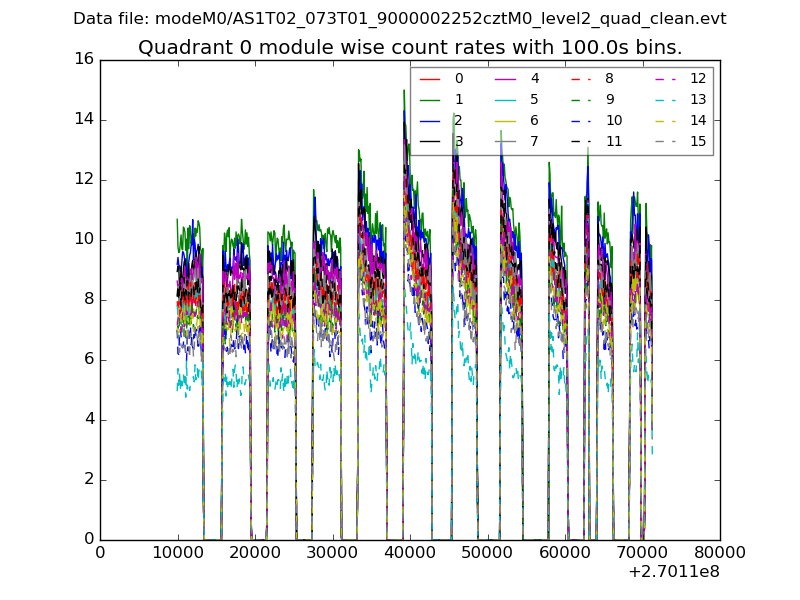
| Quadrant-wise count rates Data is divided into 100 sec bins |
 |
|
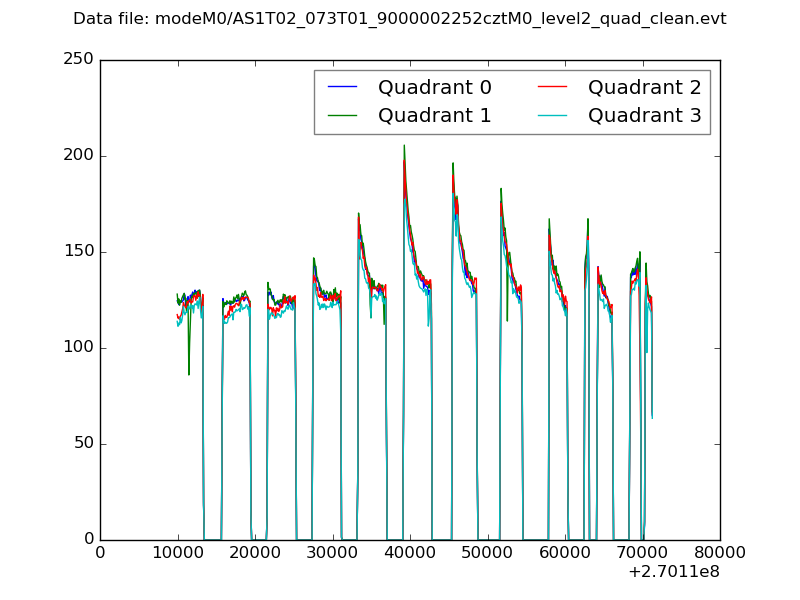
| Module-wise count rates for Quadrant A Data is divided into 100 sec bins |
 |
 |
| Module-wise count rates for Quadrant B Data is divided into 100 sec bins |
 |
 |
| Module-wise count rates for Quadrant C Data is divided into 100 sec bins |
 |
 |
| Module-wise count rates for Quadrant D Data is divided into 100 sec bins |
 |
 |
| Parameter | Plot |
|---|---|
| CZT HV Monitor |  |
| D_VDD |  |
| Temperature 1 | 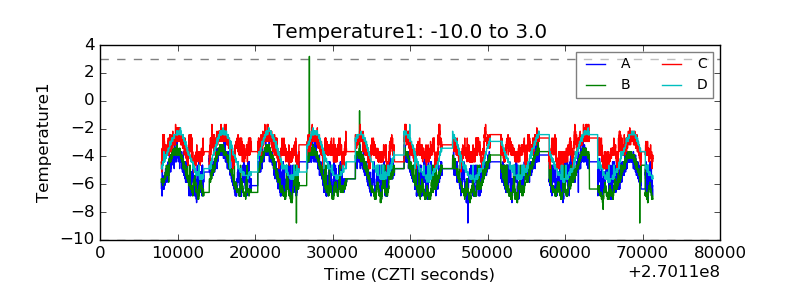 |
| Veto HV Monitor |  |
| Veto LLD |  |
| Alpha Counter |  |
| _CPM_Rate |  |
| CZT Counter | 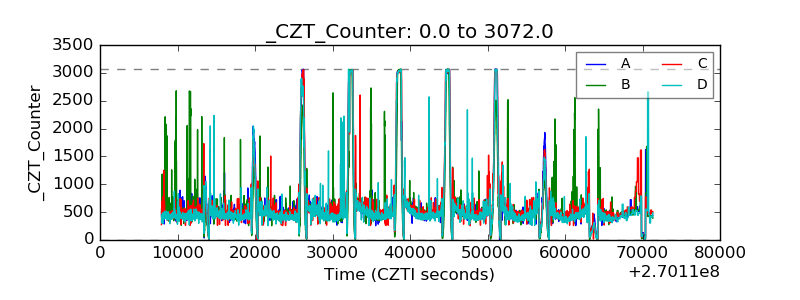 |
| +2.5 Volts monitor |  |
| +5 Volts monitor | 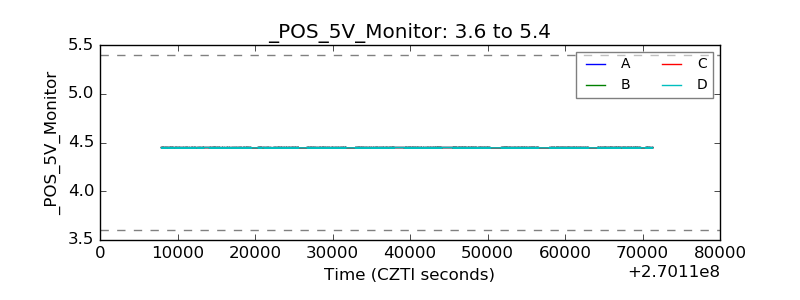 |
| _ROLL_ROT |  |
| _Roll_DEC |  |
| _Roll_RA |  |
| Veto Counter | 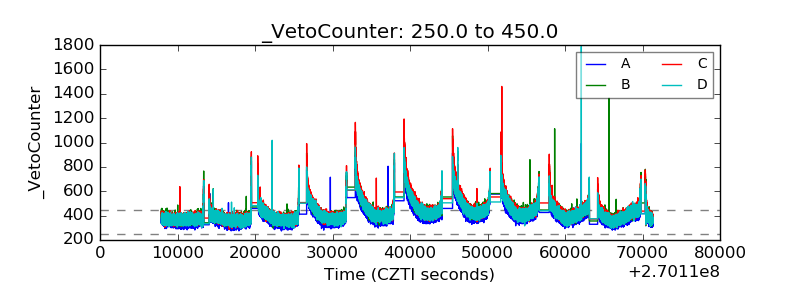 |