| Param | Original file | Final file |
|---|---|---|
| Filename | modeM0/AS1T02_072T01_9000002250cztM0_level2_bc.evt | modeM0/AS1T02_072T01_9000002250cztM0_level2_quad_clean.evt |
| Size (bytes) | 2,058,569,280 | 974,013,120 |
| Size | 1.9 GB | 928.9 MB |
| Events in quadrant A | 12,104,219 | 6,588,872 |
| Events in quadrant B | 14,009,352 | 6,649,635 |
| Events in quadrant C | 18,736,163 | 6,450,080 |
| Events in quadrant D | 14,012,992 | 6,310,437 |
| Mode M9 | |||
|---|---|---|---|
| Quadrant | BADHDUFLAG | Total packets | Discarded packets |
| A | 0 | 81 | 0 |
| B | 0 | 81 | 0 |
| C | 0 | 81 | 0 |
| D | 0 | 81 | 0 |
| Mode SS | |||
|---|---|---|---|
| Quadrant | BADHDUFLAG | Total packets | Discarded packets |
| A | 0 | 1042 | 0 |
| B | 0 | 1042 | 0 |
| C | 0 | 1042 | 0 |
| D | 0 | 1042 | 0 |
| Mode M0 | |||
|---|---|---|---|
| Quadrant | BADHDUFLAG | Total packets | Discarded packets |
| A | 0 | 108414 | 0 |
| B | 0 | 116707 | 0 |
| C | 0 | 136168 | 0 |
| D | 0 | 115462 | 0 |
| Quadrant | Total seconds | Saturated seconds | Saturation percentage |
|---|---|---|---|
| A | 51083 | 452 | 0.884834% |
| B | 51083 | 1236 | 2.419592% |
| C | 51083 | 2772 | 5.426463% |
| D | 51083 | 663 | 1.297888% |
Noise dominated data is calculated using 1-second bins in cleaned event files. If a bin has >2000 counts, and if more than 50% of those come from <1% of pixels, then it is considered to be noise-dominated and hence unusable.
| Quadrant | # 1 sec bins | Bins with >0 counts | Bins with >2000 counts | High rate bins dominated by noise | Noise dominated (total time) | Noise dominated (detector-on time) | Marked lightcurve |
|---|---|---|---|---|---|---|---|
| A | 59264 | 51062 | 1 | 1 | 0.00% | 0.00% |  |
| B | 59264 | 51061 | 71 | 71 | 0.12% | 0.14% |  |
| C | 59264 | 51061 | 103 | 103 | 0.17% | 0.20% |  |
| D | 59264 | 51063 | 39 | 39 | 0.07% | 0.08% |  |
Top three noisy pixels from each quadrant. If the there are fewer than three noisy pixels in the level2.evt file, extra rows are filled as -1
| Pixel properties | Quadrant properties | ||||||
|---|---|---|---|---|---|---|---|
| Quadrant | DetID | PixID | Counts | Sigma | Mean | Median | Sigma |
| A | 12 | 189 | 1164382 | 2010.17 | 2657 | 2615 | 577.9 |
| A | 0 | 253 | 488277 | 840.32 | 2657 | 2615 | 577.9 |
| A | 13 | 248 | 98513 | 165.93 | 2657 | 2615 | 577.9 |
| B | 10 | 16 | 1392725 | 2770.12 | 2670 | 2610 | 501.8 |
| B | 3 | 64 | 808683 | 1606.28 | 2670 | 2610 | 501.8 |
| B | 10 | 245 | 325879 | 644.19 | 2670 | 2610 | 501.8 |
| C | 4 | 254 | 4466623 | 7858.5 | 2555 | 2528 | 568.1 |
| C | 3 | 233 | 4140821 | 7284.96 | 2555 | 2528 | 568.1 |
| C | 7 | 247 | 81863 | 139.66 | 2555 | 2528 | 568.1 |
| D | 2 | 16 | 2176918 | 3572.33 | 2621 | 2536 | 608.7 |
| D | 7 | 38 | 510771 | 834.99 | 2621 | 2536 | 608.7 |
| D | 2 | 136 | 334143 | 544.8 | 2621 | 2536 | 608.7 |
Histogram calculated using DETX and DETY for each event in the final _common_clean file
| Quadrant A | 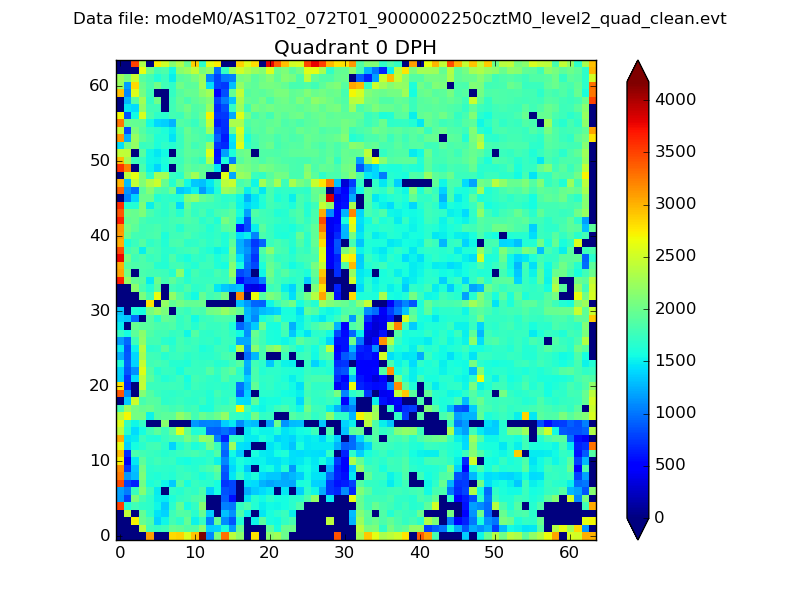 |
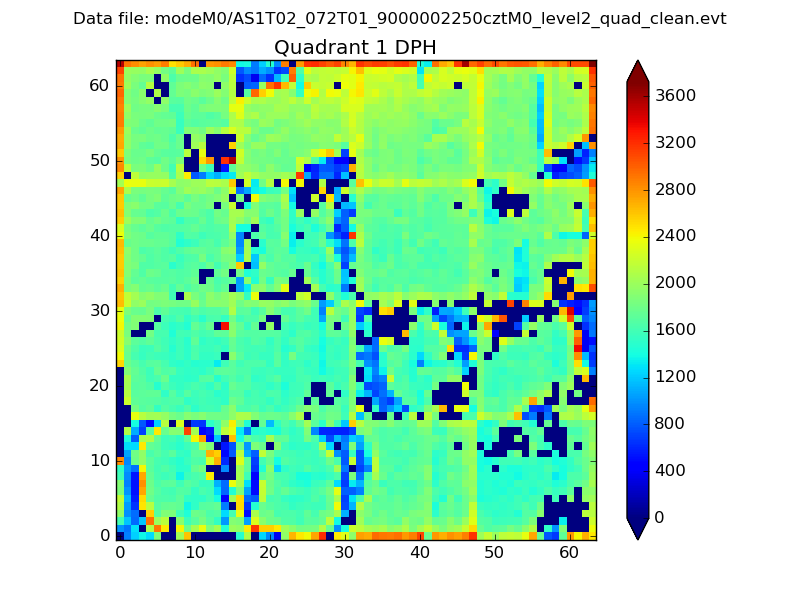 |
Quadrant B |
|---|---|---|---|
| Quadrant D |  |
 |
Quadrant C |
| Plot type | Count rate plots | Images |
|---|---|---|
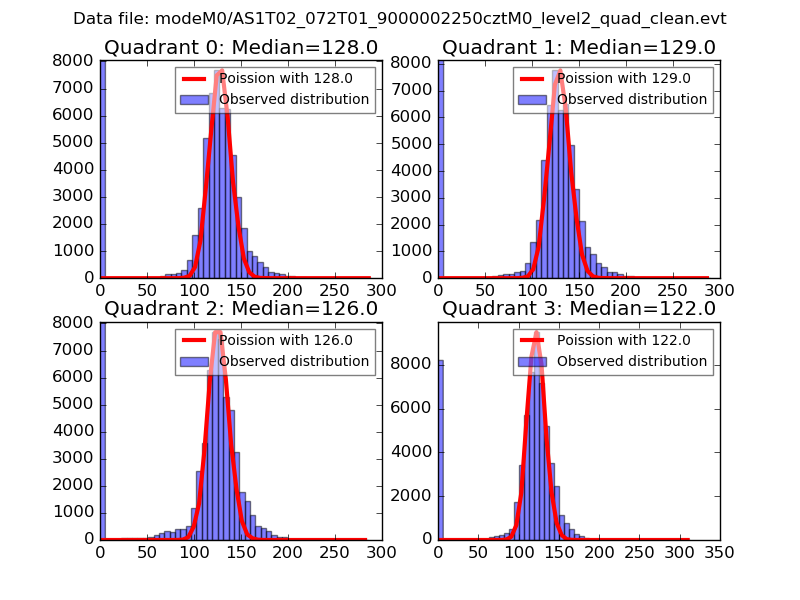
| Comparison with Poisson distribution Blue bars denote a histogram of data divided into 1 sec bins. Red curve is a Poisson curve with rate = median count rate of data. |
 |
 |
| Quadrant-wise count rates Data is divided into 100 sec bins |
 |
|
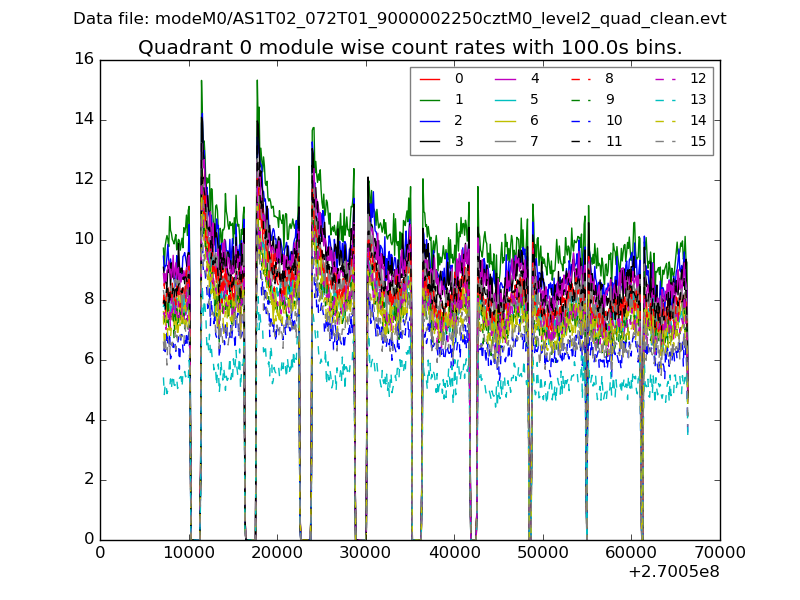
| Module-wise count rates for Quadrant A Data is divided into 100 sec bins |
 |
 |
| Module-wise count rates for Quadrant B Data is divided into 100 sec bins |
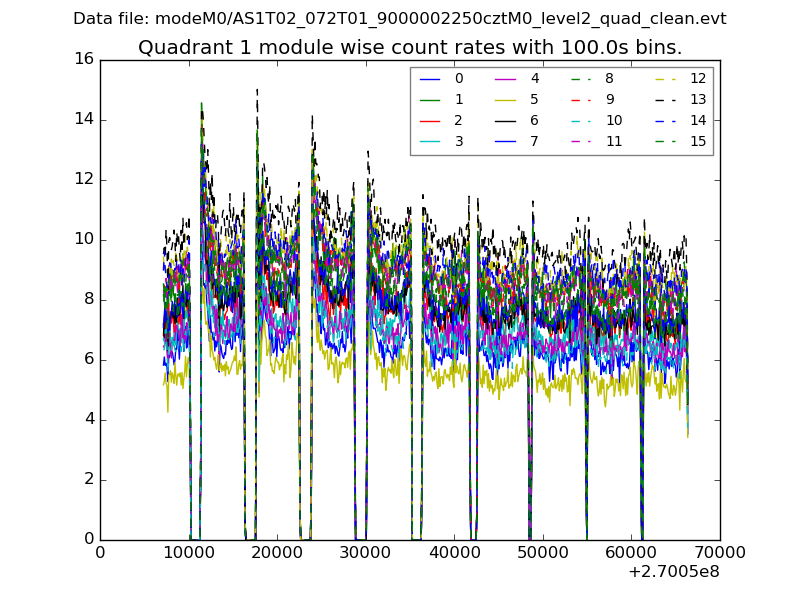 |
 |
| Module-wise count rates for Quadrant C Data is divided into 100 sec bins |
 |
 |
| Module-wise count rates for Quadrant D Data is divided into 100 sec bins |
 |
 |
| Parameter | Plot |
|---|---|
| CZT HV Monitor |  |
| D_VDD |  |
| Temperature 1 | 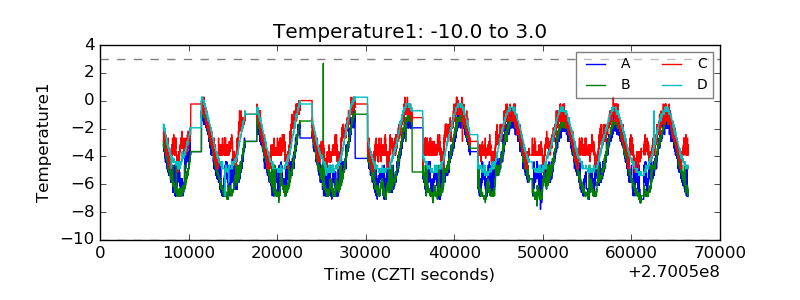 |
| Veto HV Monitor |  |
| Veto LLD |  |
| Alpha Counter |  |
| _CPM_Rate |  |
| CZT Counter |  |
| +2.5 Volts monitor |  |
| +5 Volts monitor |  |
| _ROLL_ROT |  |
| _Roll_DEC |  |
| _Roll_RA |  |
| Veto Counter |  |