| Param | Original file | Final file |
|---|---|---|
| Filename | modeM0/AS1A04_105T01_9000002248cztM0_level2_bc.evt | modeM0/AS1A04_105T01_9000002248cztM0_level2_quad_clean.evt |
| Size (bytes) | 5,237,496,000 | 1,208,900,160 |
| Size | 4.9 GB | 1.1 GB |
| Events in quadrant A | 62,116,212 | 7,476,159 |
| Events in quadrant B | 35,125,410 | 7,646,738 |
| Events in quadrant C | 31,872,026 | 7,631,249 |
| Events in quadrant D | 23,167,112 | 7,463,116 |
| Mode M0 | |||
|---|---|---|---|
| Quadrant | BADHDUFLAG | Total packets | Discarded packets |
| A | 0 | 325412 | 0 |
| B | 0 | 255650 | 0 |
| C | 0 | 243659 | 0 |
| D | 0 | 206978 | 0 |
| Mode SS | |||
|---|---|---|---|
| Quadrant | BADHDUFLAG | Total packets | Discarded packets |
| A | 0 | 1906 | 0 |
| B | 0 | 1906 | 0 |
| C | 0 | 1906 | 0 |
| D | 0 | 1906 | 0 |
| Mode M9 | |||
|---|---|---|---|
| Quadrant | BADHDUFLAG | Total packets | Discarded packets |
| A | 0 | 153 | 0 |
| B | 0 | 153 | 0 |
| C | 0 | 153 | 0 |
| D | 0 | 153 | 0 |
| Quadrant | Total seconds | Saturated seconds | Saturation percentage |
|---|---|---|---|
| A | 93292 | 11738 | 12.582001% |
| B | 93292 | 7722 | 8.277237% |
| C | 93292 | 3406 | 3.650903% |
| D | 93292 | 1663 | 1.782575% |
Noise dominated data is calculated using 1-second bins in cleaned event files. If a bin has >2000 counts, and if more than 50% of those come from <1% of pixels, then it is considered to be noise-dominated and hence unusable.
| Quadrant | # 1 sec bins | Bins with >0 counts | Bins with >2000 counts | High rate bins dominated by noise | Noise dominated (total time) | Noise dominated (detector-on time) | Marked lightcurve |
|---|---|---|---|---|---|---|---|
| A | 108683 | 93286 | 4093 | 4093 | 3.77% | 4.39% |  |
| B | 108683 | 93278 | 987 | 987 | 0.91% | 1.06% |  |
| C | 108683 | 93286 | 58 | 58 | 0.05% | 0.06% |  |
| D | 108683 | 93285 | 196 | 196 | 0.18% | 0.21% |  |
Top three noisy pixels from each quadrant. If the there are fewer than three noisy pixels in the level2.evt file, extra rows are filled as -1
| Pixel properties | Quadrant properties | ||||||
|---|---|---|---|---|---|---|---|
| Quadrant | DetID | PixID | Counts | Sigma | Mean | Median | Sigma |
| A | 0 | 253 | 42019768 | 40901.42 | 4684 | 4593 | 1027.2 |
| A | 12 | 189 | 1725247 | 1675.04 | 4684 | 4593 | 1027.2 |
| A | 9 | 143 | 187097 | 177.67 | 4684 | 4593 | 1027.2 |
| B | 3 | 112 | 12065228 | 13458.21 | 4729 | 4605 | 896.2 |
| B | 3 | 64 | 1529668 | 1701.79 | 4729 | 4605 | 896.2 |
| B | 10 | 16 | 637865 | 706.64 | 4729 | 4605 | 896.2 |
| C | 3 | 233 | 10416544 | 10184.96 | 4637 | 4577 | 1022.3 |
| C | 4 | 254 | 2655360 | 2592.99 | 4637 | 4577 | 1022.3 |
| C | 7 | 247 | 351972 | 339.82 | 4637 | 4577 | 1022.3 |
| D | 7 | 38 | 1066097 | 980.4 | 4721 | 4554 | 1082.8 |
| D | 2 | 16 | 703516 | 645.53 | 4721 | 4554 | 1082.8 |
| D | 1 | 255 | 606830 | 556.24 | 4721 | 4554 | 1082.8 |
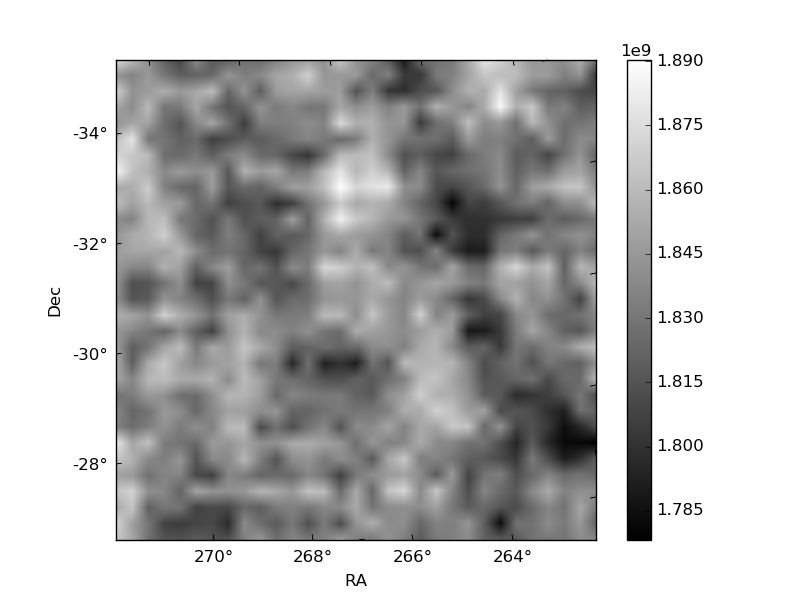
Histogram calculated using DETX and DETY for each event in the final _common_clean file
| Quadrant A |  |
 |
Quadrant B |
|---|---|---|---|
| Quadrant D |  |
 |
Quadrant C |
| Plot type | Count rate plots | Images |
|---|---|---|
| Comparison with Poisson distribution Blue bars denote a histogram of data divided into 1 sec bins. Red curve is a Poisson curve with rate = median count rate of data. |
 |
 |
| Quadrant-wise count rates Data is divided into 100 sec bins |
 |
|
| Module-wise count rates for Quadrant A Data is divided into 100 sec bins |
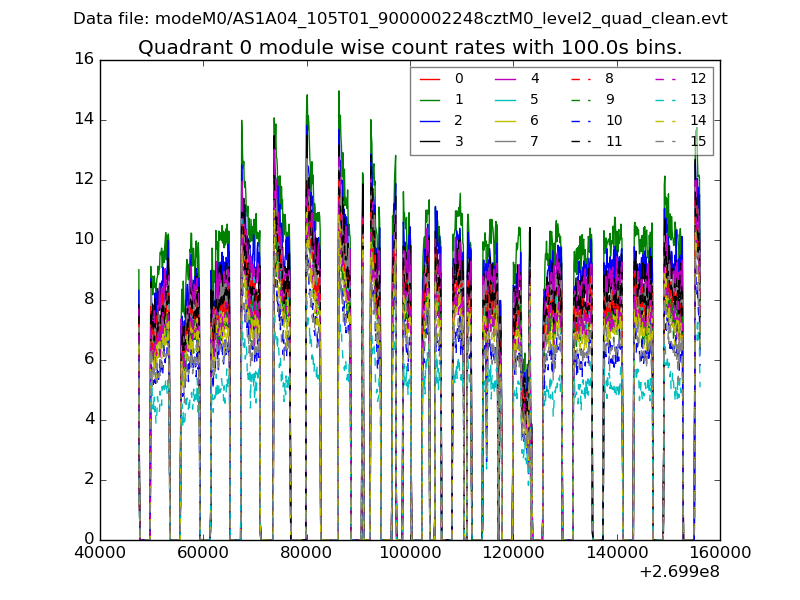 |
 |
| Module-wise count rates for Quadrant B Data is divided into 100 sec bins |
 |
 |
| Module-wise count rates for Quadrant C Data is divided into 100 sec bins |
 |
 |
| Module-wise count rates for Quadrant D Data is divided into 100 sec bins |
 |
 |
| Parameter | Plot |
|---|---|
| CZT HV Monitor |  |
| D_VDD |  |
| Temperature 1 |  |
| Veto HV Monitor |  |
| Veto LLD |  |
| Alpha Counter |  |
| _CPM_Rate |  |
| CZT Counter |  |
| +2.5 Volts monitor | 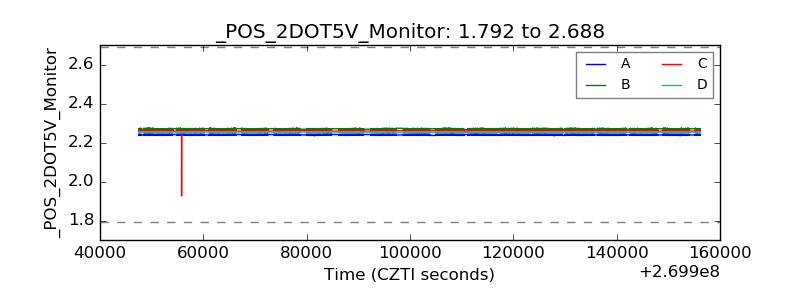 |
| +5 Volts monitor |  |
| _ROLL_ROT |  |
| _Roll_DEC |  |
| _Roll_RA |  |
| Veto Counter |  |