| Param | Original file | Final file |
|---|---|---|
| Filename | modeM0/AS1T02_071T01_9000002246cztM0_level2_bc.evt | modeM0/AS1T02_071T01_9000002246cztM0_level2_quad_clean.evt |
| Size (bytes) | 2,662,352,640 | 918,377,280 |
| Size | 2.5 GB | 875.8 MB |
| Events in quadrant A | 25,699,783 | 6,142,284 |
| Events in quadrant B | 20,233,782 | 6,105,319 |
| Events in quadrant C | 19,888,078 | 6,230,602 |
| Events in quadrant D | 11,533,216 | 6,032,005 |
| Mode M9 | |||
|---|---|---|---|
| Quadrant | BADHDUFLAG | Total packets | Discarded packets |
| A | 0 | 93 | 0 |
| B | 0 | 93 | 0 |
| C | 0 | 93 | 0 |
| D | 0 | 93 | 0 |
| Mode SS | |||
|---|---|---|---|
| Quadrant | BADHDUFLAG | Total packets | Discarded packets |
| A | 0 | 978 | 0 |
| B | 0 | 978 | 0 |
| C | 0 | 978 | 0 |
| D | 0 | 978 | 0 |
| Mode M0 | |||
|---|---|---|---|
| Quadrant | BADHDUFLAG | Total packets | Discarded packets |
| A | 0 | 148369 | 0 |
| B | 0 | 139334 | 0 |
| C | 0 | 136554 | 0 |
| D | 0 | 103638 | 0 |
| Quadrant | Total seconds | Saturated seconds | Saturation percentage |
|---|---|---|---|
| A | 48209 | 2427 | 5.034330% |
| B | 48209 | 4441 | 9.211973% |
| C | 48209 | 950 | 1.970586% |
| D | 48209 | 470 | 0.974922% |
Noise dominated data is calculated using 1-second bins in cleaned event files. If a bin has >2000 counts, and if more than 50% of those come from <1% of pixels, then it is considered to be noise-dominated and hence unusable.
| Quadrant | # 1 sec bins | Bins with >0 counts | Bins with >2000 counts | High rate bins dominated by noise | Noise dominated (total time) | Noise dominated (detector-on time) | Marked lightcurve |
|---|---|---|---|---|---|---|---|
| A | 62839 | 48211 | 312 | 312 | 0.50% | 0.65% | 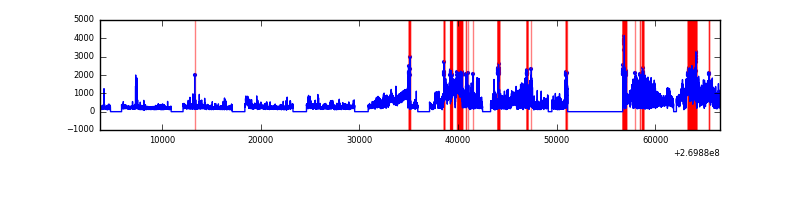 |
| B | 62839 | 48198 | 612 | 612 | 0.97% | 1.27% |  |
| C | 62839 | 48209 | 35 | 35 | 0.06% | 0.07% |  |
| D | 62839 | 48210 | 39 | 39 | 0.06% | 0.08% |  |
Top three noisy pixels from each quadrant. If the there are fewer than three noisy pixels in the level2.evt file, extra rows are filled as -1
| Pixel properties | Quadrant properties | ||||||
|---|---|---|---|---|---|---|---|
| Quadrant | DetID | PixID | Counts | Sigma | Mean | Median | Sigma |
| A | 0 | 253 | 14699866 | 27274.63 | 2493 | 2456 | 538.9 |
| A | 12 | 189 | 1233442 | 2284.39 | 2493 | 2456 | 538.9 |
| A | 13 | 248 | 87297 | 157.44 | 2493 | 2456 | 538.9 |
| B | 3 | 112 | 7708038 | 16772.78 | 2462 | 2407 | 459.4 |
| B | 3 | 64 | 1133148 | 2461.27 | 2462 | 2407 | 459.4 |
| B | 0 | 229 | 490880 | 1063.25 | 2462 | 2407 | 459.4 |
| C | 3 | 233 | 9244121 | 16988.7 | 2471 | 2453 | 544.0 |
| C | 4 | 254 | 820928 | 1504.58 | 2471 | 2453 | 544.0 |
| C | 7 | 247 | 86023 | 153.62 | 2471 | 2453 | 544.0 |
| D | 2 | 33 | 690393 | 1196.89 | 2499 | 2425 | 574.8 |
| D | 7 | 38 | 302183 | 521.5 | 2499 | 2425 | 574.8 |
| D | 2 | 234 | 173444 | 297.53 | 2499 | 2425 | 574.8 |
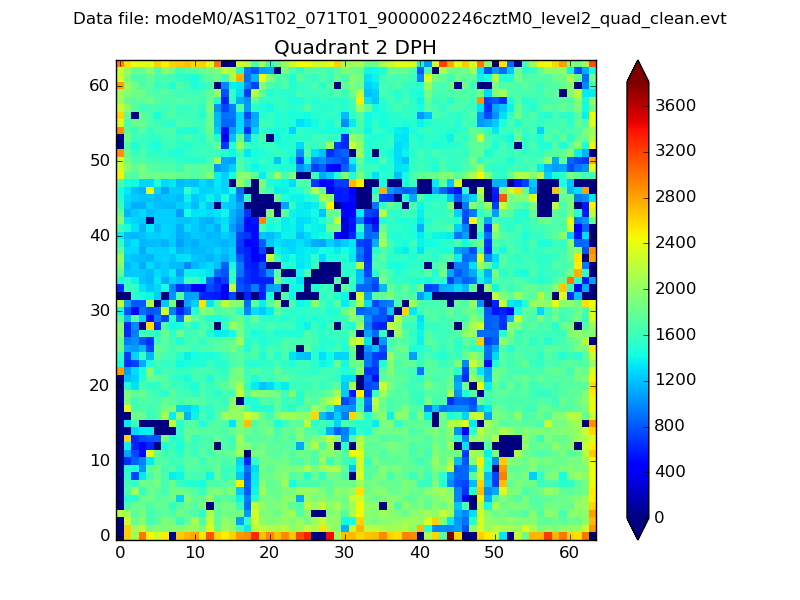
Histogram calculated using DETX and DETY for each event in the final _common_clean file
| Quadrant A |  |
 |
Quadrant B |
|---|---|---|---|
| Quadrant D | 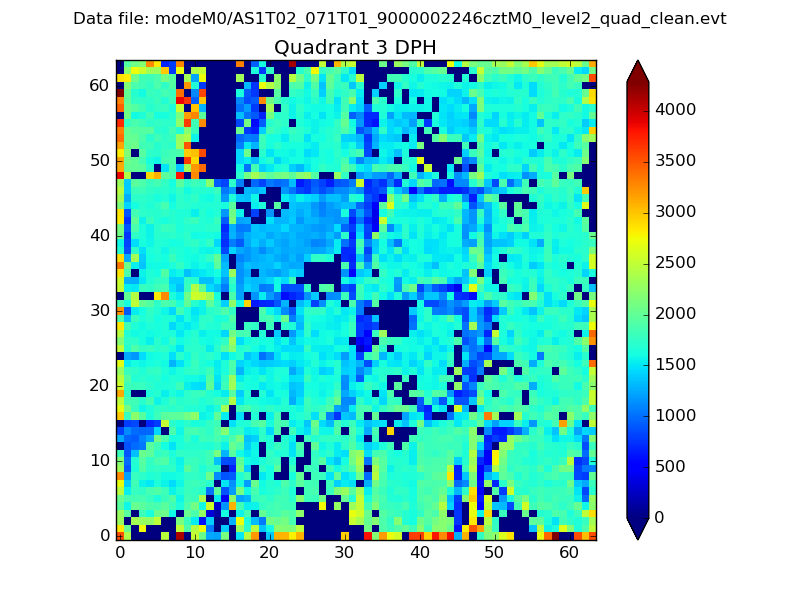 |
 |
Quadrant C |
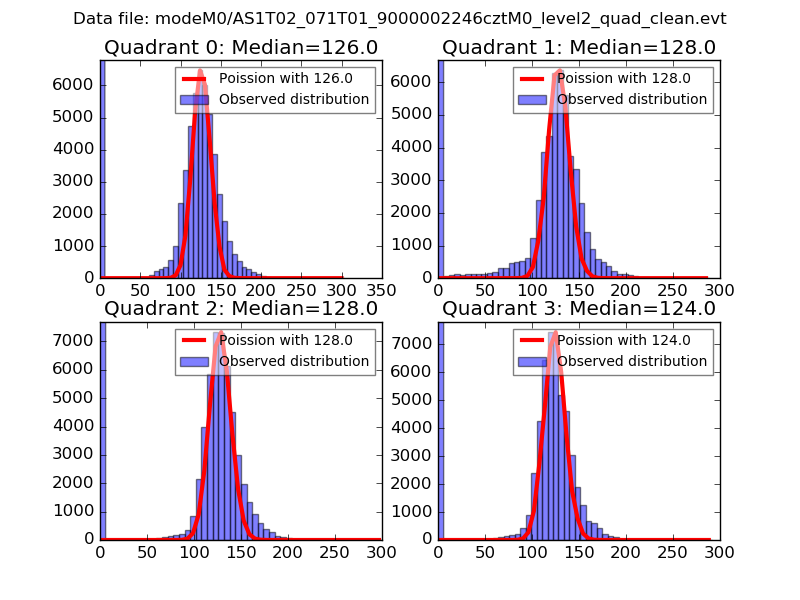
| Plot type | Count rate plots | Images |
|---|---|---|
| Comparison with Poisson distribution Blue bars denote a histogram of data divided into 1 sec bins. Red curve is a Poisson curve with rate = median count rate of data. |
 |
 |
| Quadrant-wise count rates Data is divided into 100 sec bins |
 |
|
| Module-wise count rates for Quadrant A Data is divided into 100 sec bins |
 |
 |
| Module-wise count rates for Quadrant B Data is divided into 100 sec bins |
 |
 |
| Module-wise count rates for Quadrant C Data is divided into 100 sec bins |
 |
 |
| Module-wise count rates for Quadrant D Data is divided into 100 sec bins |
 |
 |
| Parameter | Plot |
|---|---|
| CZT HV Monitor | 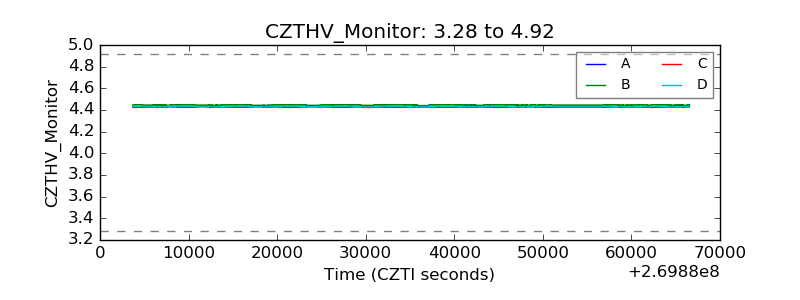 |
| D_VDD |  |
| Temperature 1 | 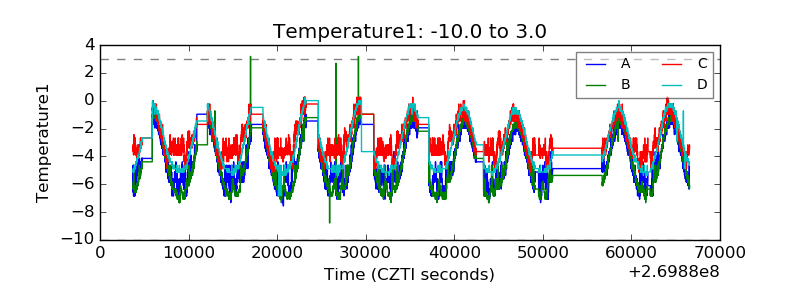 |
| Veto HV Monitor |  |
| Veto LLD |  |
| Alpha Counter |  |
| _CPM_Rate |  |
| CZT Counter |  |
| +2.5 Volts monitor |  |
| +5 Volts monitor |  |
| _ROLL_ROT |  |
| _Roll_DEC |  |
| _Roll_RA |  |
| Veto Counter |  |