| Param | Original file | Final file |
|---|---|---|
| Filename | modeM0/AS1T02_070T01_9000002244cztM0_level2_bc.evt | modeM0/AS1T02_070T01_9000002244cztM0_level2_quad_clean.evt |
| Size (bytes) | 337,982,400 | 111,381,120 |
| Size | 322.3 MB | 106.2 MB |
| Events in quadrant A | 2,056,571 | 683,022 |
| Events in quadrant B | 2,294,398 | 688,492 |
| Events in quadrant C | 3,017,644 | 670,908 |
| Events in quadrant D | 2,192,019 | 651,506 |
| Mode M9 | |||
|---|---|---|---|
| Quadrant | BADHDUFLAG | Total packets | Discarded packets |
| A | 0 | 16 | 0 |
| B | 0 | 16 | 0 |
| C | 0 | 16 | 0 |
| D | 0 | 16 | 0 |
| Mode M0 | |||
|---|---|---|---|
| Quadrant | BADHDUFLAG | Total packets | Discarded packets |
| A | 0 | 20284 | 0 |
| B | 0 | 22005 | 0 |
| C | 0 | 23436 | 0 |
| D | 0 | 20667 | 0 |
| Mode SS | |||
|---|---|---|---|
| Quadrant | BADHDUFLAG | Total packets | Discarded packets |
| A | 0 | 202 | 0 |
| B | 0 | 202 | 0 |
| C | 0 | 202 | 0 |
| D | 0 | 202 | 0 |
| Quadrant | Total seconds | Saturated seconds | Saturation percentage |
|---|---|---|---|
| A | 9791 | 101 | 1.031560% |
| B | 9791 | 305 | 3.115106% |
| C | 9791 | 96 | 0.980492% |
| D | 9791 | 112 | 1.143908% |
Noise dominated data is calculated using 1-second bins in cleaned event files. If a bin has >2000 counts, and if more than 50% of those come from <1% of pixels, then it is considered to be noise-dominated and hence unusable.
| Quadrant | # 1 sec bins | Bins with >0 counts | Bins with >2000 counts | High rate bins dominated by noise | Noise dominated (total time) | Noise dominated (detector-on time) | Marked lightcurve |
|---|---|---|---|---|---|---|---|
| A | 11506 | 9799 | 0 | 0 | 0.00% | 0.00% |  |
| B | 11506 | 9800 | 1 | 1 | 0.01% | 0.01% |  |
| C | 11506 | 9799 | 0 | 0 | 0.00% | 0.00% |  |
| D | 11506 | 9799 | 13 | 13 | 0.11% | 0.13% |  |
Top three noisy pixels from each quadrant. If the there are fewer than three noisy pixels in the level2.evt file, extra rows are filled as -1
| Pixel properties | Quadrant properties | ||||||
|---|---|---|---|---|---|---|---|
| Quadrant | DetID | PixID | Counts | Sigma | Mean | Median | Sigma |
| A | 12 | 189 | 131629 | 1187.6 | 494 | 483 | 110.4 |
| A | 9 | 143 | 9626 | 82.8 | 494 | 483 | 110.4 |
| A | 13 | 248 | 7417 | 62.79 | 494 | 483 | 110.4 |
| B | 3 | 64 | 169336 | 1774.18 | 492 | 478 | 95.2 |
| B | 10 | 245 | 58930 | 614.15 | 492 | 478 | 95.2 |
| B | 0 | 189 | 42984 | 446.61 | 492 | 478 | 95.2 |
| C | 3 | 233 | 964004 | 8960.83 | 480 | 473 | 107.5 |
| C | 7 | 247 | 172610 | 1600.87 | 480 | 473 | 107.5 |
| C | 14 | 234 | 3666 | 29.69 | 480 | 473 | 107.5 |
| D | 2 | 33 | 145638 | 1270.3 | 486 | 465 | 114.3 |
| D | 7 | 38 | 37767 | 326.4 | 486 | 465 | 114.3 |
| D | 2 | 234 | 37062 | 320.23 | 486 | 465 | 114.3 |
Histogram calculated using DETX and DETY for each event in the final _common_clean file
| Quadrant A |  |
 |
Quadrant B |
|---|---|---|---|
| Quadrant D |  |
 |
Quadrant C |
| Plot type | Count rate plots | Images |
|---|---|---|
| Comparison with Poisson distribution Blue bars denote a histogram of data divided into 1 sec bins. Red curve is a Poisson curve with rate = median count rate of data. |
 |
 |
| Quadrant-wise count rates Data is divided into 100 sec bins |
 |
|
| Module-wise count rates for Quadrant A Data is divided into 100 sec bins |
 |
 |
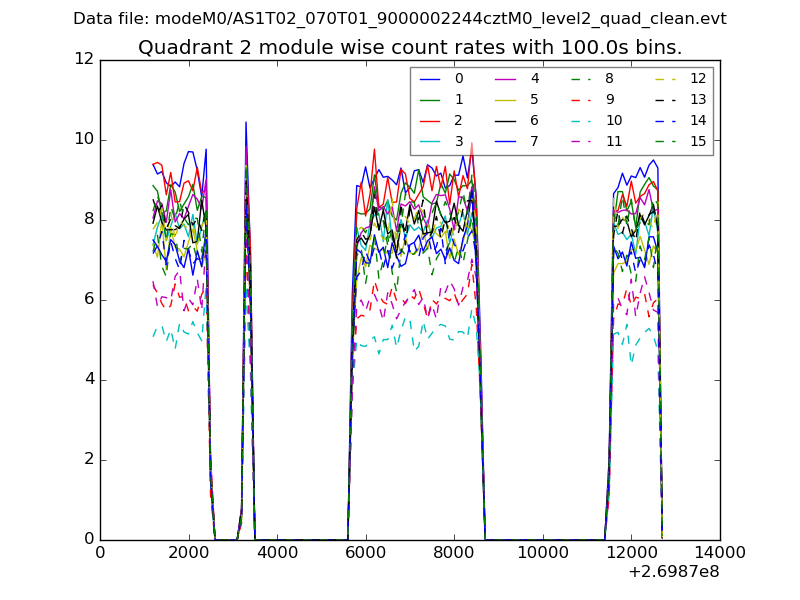
| Module-wise count rates for Quadrant B Data is divided into 100 sec bins |
 |
 |
| Module-wise count rates for Quadrant C Data is divided into 100 sec bins |
 |
 |
| Module-wise count rates for Quadrant D Data is divided into 100 sec bins |
 |
 |
| Parameter | Plot |
|---|---|
| CZT HV Monitor |  |
| D_VDD |  |
| Temperature 1 |  |
| Veto HV Monitor |  |
| Veto LLD |  |
| Alpha Counter |  |
| _CPM_Rate | 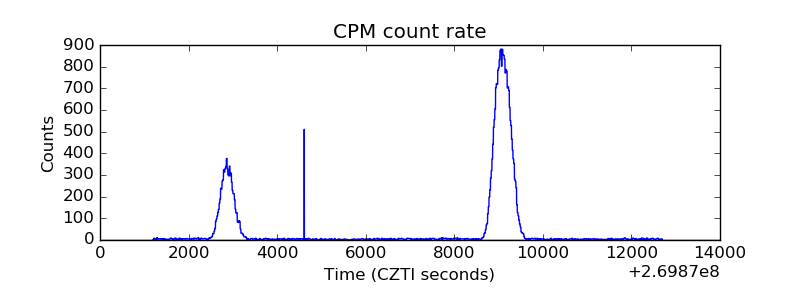 |
| CZT Counter |  |
| +2.5 Volts monitor |  |
| +5 Volts monitor |  |
| _ROLL_ROT |  |
| _Roll_DEC |  |
| _Roll_RA |  |
| Veto Counter |  |