| Param | Original file | Final file |
|---|---|---|
| Filename | modeM0/AS1C03_015T04_9000002240cztM0_level2_bc.evt | modeM0/AS1C03_015T04_9000002240cztM0_level2_quad_clean.evt |
| Size (bytes) | 298,964,160 | 114,897,600 |
| Size | 285.1 MB | 109.6 MB |
| Events in quadrant A | 1,442,207 | 767,492 |
| Events in quadrant B | 3,323,583 | 725,747 |
| Events in quadrant C | 2,008,331 | 781,950 |
| Events in quadrant D | 1,826,838 | 748,154 |
| Mode M0 | |||
|---|---|---|---|
| Quadrant | BADHDUFLAG | Total packets | Discarded packets |
| A | 0 | 13726 | 0 |
| B | 0 | 21582 | 0 |
| C | 0 | 15436 | 0 |
| D | 0 | 14915 | 0 |
| Mode M9 | |||
|---|---|---|---|
| Quadrant | BADHDUFLAG | Total packets | Discarded packets |
| A | 0 | 13 | 0 |
| B | 0 | 13 | 0 |
| C | 0 | 13 | 0 |
| D | 0 | 13 | 0 |
| Mode SS | |||
|---|---|---|---|
| Quadrant | BADHDUFLAG | Total packets | Discarded packets |
| A | 0 | 136 | 0 |
| B | 0 | 136 | 0 |
| C | 0 | 136 | 0 |
| D | 0 | 136 | 0 |
| Quadrant | Total seconds | Saturated seconds | Saturation percentage |
|---|---|---|---|
| A | 6538 | 69 | 1.055369% |
| B | 6538 | 1028 | 15.723463% |
| C | 6538 | 67 | 1.024778% |
| D | 6538 | 136 | 2.080147% |
Noise dominated data is calculated using 1-second bins in cleaned event files. If a bin has >2000 counts, and if more than 50% of those come from <1% of pixels, then it is considered to be noise-dominated and hence unusable.
| Quadrant | # 1 sec bins | Bins with >0 counts | Bins with >2000 counts | High rate bins dominated by noise | Noise dominated (total time) | Noise dominated (detector-on time) | Marked lightcurve |
|---|---|---|---|---|---|---|---|
| A | 7699 | 6538 | 0 | 0 | 0.00% | 0.00% |  |
| B | 7699 | 6540 | 92 | 92 | 1.19% | 1.41% |  |
| C | 7699 | 6538 | 0 | 0 | 0.00% | 0.00% |  |
| D | 7698 | 6538 | 27 | 27 | 0.35% | 0.41% |  |
Top three noisy pixels from each quadrant. If the there are fewer than three noisy pixels in the level2.evt file, extra rows are filled as -1
| Pixel properties | Quadrant properties | ||||||
|---|---|---|---|---|---|---|---|
| Quadrant | DetID | PixID | Counts | Sigma | Mean | Median | Sigma |
| A | 12 | 189 | 99464 | 1282.17 | 344 | 338 | 77.3 |
| A | 3 | 1 | 6609 | 81.11 | 344 | 338 | 77.3 |
| A | 13 | 248 | 6099 | 74.52 | 344 | 338 | 77.3 |
| B | 3 | 112 | 1791402 | 28244.96 | 326 | 319 | 63.4 |
| B | 3 | 64 | 107839 | 1695.57 | 326 | 319 | 63.4 |
| B | 0 | 189 | 44420 | 695.46 | 326 | 319 | 63.4 |
| C | 3 | 233 | 650166 | 8168.07 | 344 | 339 | 79.6 |
| C | 0 | 207 | 5859 | 69.38 | 344 | 339 | 79.6 |
| C | 7 | 247 | 2370 | 25.52 | 344 | 339 | 79.6 |
| D | 2 | 33 | 149966 | 1836.65 | 344 | 332 | 81.5 |
| D | 4 | 95 | 116165 | 1421.77 | 344 | 332 | 81.5 |
| D | 7 | 38 | 86807 | 1061.42 | 344 | 332 | 81.5 |
Histogram calculated using DETX and DETY for each event in the final _common_clean file
| Quadrant A |  |
 |
Quadrant B |
|---|---|---|---|
| Quadrant D |  |
 |
Quadrant C |
| Plot type | Count rate plots | Images |
|---|---|---|
| Comparison with Poisson distribution Blue bars denote a histogram of data divided into 1 sec bins. Red curve is a Poisson curve with rate = median count rate of data. |
 |
 |
| Quadrant-wise count rates Data is divided into 100 sec bins |
 |
|
| Module-wise count rates for Quadrant A Data is divided into 100 sec bins |
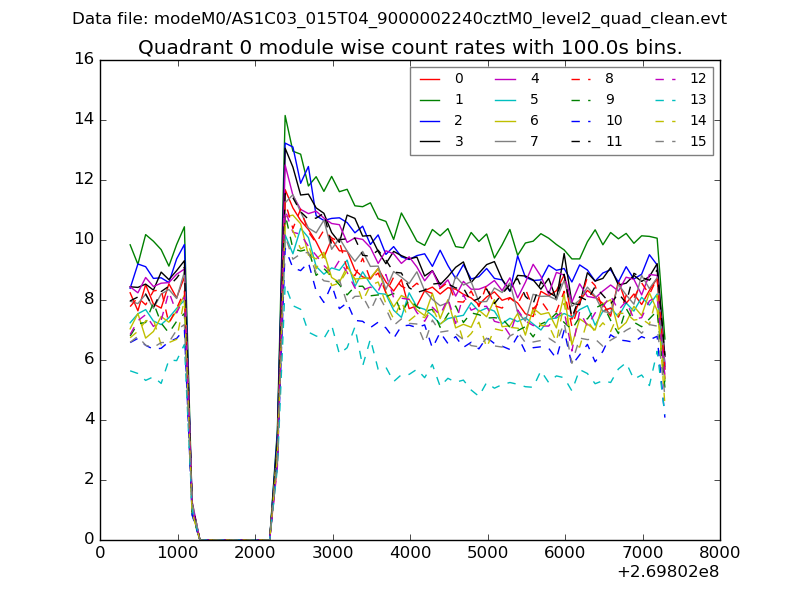 |
 |
| Module-wise count rates for Quadrant B Data is divided into 100 sec bins |
 |
 |
| Module-wise count rates for Quadrant C Data is divided into 100 sec bins |
 |
 |
| Module-wise count rates for Quadrant D Data is divided into 100 sec bins |
 |
 |
| Parameter | Plot |
|---|---|
| CZT HV Monitor |  |
| D_VDD |  |
| Temperature 1 | 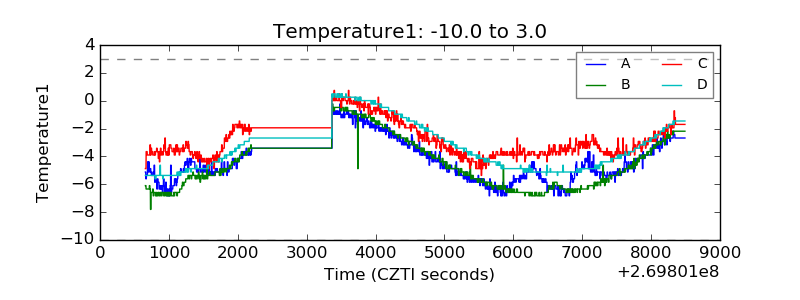 |
| Veto HV Monitor | 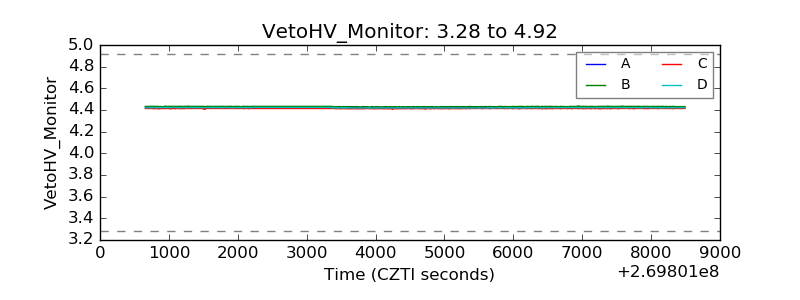 |
| Veto LLD |  |
| Alpha Counter |  |
| _CPM_Rate |  |
| CZT Counter |  |
| +2.5 Volts monitor |  |
| +5 Volts monitor |  |
| _ROLL_ROT |  |
| _Roll_DEC |  |
| _Roll_RA |  |
| Veto Counter |  |