| Param | Original file | Final file |
|---|---|---|
| Filename | modeM0/AS1G08_035T01_9000002234cztM0_level2_bc.evt | modeM0/AS1G08_035T01_9000002234cztM0_level2_quad_clean.evt |
| Size (bytes) | 663,232,320 | 224,066,880 |
| Size | 632.5 MB | 213.7 MB |
| Events in quadrant A | 5,333,420 | 1,402,281 |
| Events in quadrant B | 4,378,082 | 1,414,832 |
| Events in quadrant C | 4,527,563 | 1,403,535 |
| Events in quadrant D | 4,631,913 | 1,342,760 |
| Mode M0 | |||
|---|---|---|---|
| Quadrant | BADHDUFLAG | Total packets | Discarded packets |
| A | 0 | 43295 | 0 |
| B | 0 | 39662 | 0 |
| C | 0 | 39459 | 0 |
| D | 0 | 39336 | 0 |
| Mode SS | |||
|---|---|---|---|
| Quadrant | BADHDUFLAG | Total packets | Discarded packets |
| A | 0 | 368 | 0 |
| B | 0 | 368 | 0 |
| C | 0 | 368 | 0 |
| D | 0 | 368 | 0 |
| Mode M9 | |||
|---|---|---|---|
| Quadrant | BADHDUFLAG | Total packets | Discarded packets |
| A | 0 | 31 | 0 |
| B | 0 | 31 | 0 |
| C | 0 | 31 | 0 |
| D | 0 | 31 | 0 |
| Quadrant | Total seconds | Saturated seconds | Saturation percentage |
|---|---|---|---|
| A | 17729 | 221 | 1.246545% |
| B | 17729 | 376 | 2.120819% |
| C | 17729 | 151 | 0.851712% |
| D | 17729 | 331 | 1.866998% |
Noise dominated data is calculated using 1-second bins in cleaned event files. If a bin has >2000 counts, and if more than 50% of those come from <1% of pixels, then it is considered to be noise-dominated and hence unusable.
| Quadrant | # 1 sec bins | Bins with >0 counts | Bins with >2000 counts | High rate bins dominated by noise | Noise dominated (total time) | Noise dominated (detector-on time) | Marked lightcurve |
|---|---|---|---|---|---|---|---|
| A | 21071 | 17728 | 0 | 0 | 0.00% | 0.00% |  |
| B | 21071 | 17726 | 18 | 18 | 0.09% | 0.10% |  |
| C | 21071 | 17729 | 0 | 0 | 0.00% | 0.00% |  |
| D | 21071 | 17728 | 75 | 75 | 0.36% | 0.42% |  |
Top three noisy pixels from each quadrant. If the there are fewer than three noisy pixels in the level2.evt file, extra rows are filled as -1
| Pixel properties | Quadrant properties | ||||||
|---|---|---|---|---|---|---|---|
| Quadrant | DetID | PixID | Counts | Sigma | Mean | Median | Sigma |
| A | 15 | 239 | 1663546 | 8332.39 | 897 | 877 | 199.5 |
| A | 12 | 189 | 177858 | 886.93 | 897 | 877 | 199.5 |
| A | 13 | 248 | 20556 | 98.62 | 897 | 877 | 199.5 |
| B | 3 | 64 | 414039 | 2385.67 | 902 | 879 | 173.2 |
| B | 0 | 229 | 182280 | 1047.45 | 902 | 879 | 173.2 |
| B | 3 | 209 | 63363 | 360.8 | 902 | 879 | 173.2 |
| C | 3 | 233 | 1057436 | 5384.75 | 879 | 866 | 196.2 |
| C | 14 | 234 | 17539 | 84.97 | 879 | 866 | 196.2 |
| C | 0 | 207 | 6005 | 26.19 | 879 | 866 | 196.2 |
| D | 2 | 33 | 489625 | 2324.73 | 882 | 850 | 210.3 |
| D | 2 | 16 | 292233 | 1385.89 | 882 | 850 | 210.3 |
| D | 7 | 38 | 103172 | 486.67 | 882 | 850 | 210.3 |
Histogram calculated using DETX and DETY for each event in the final _common_clean file
| Quadrant A | 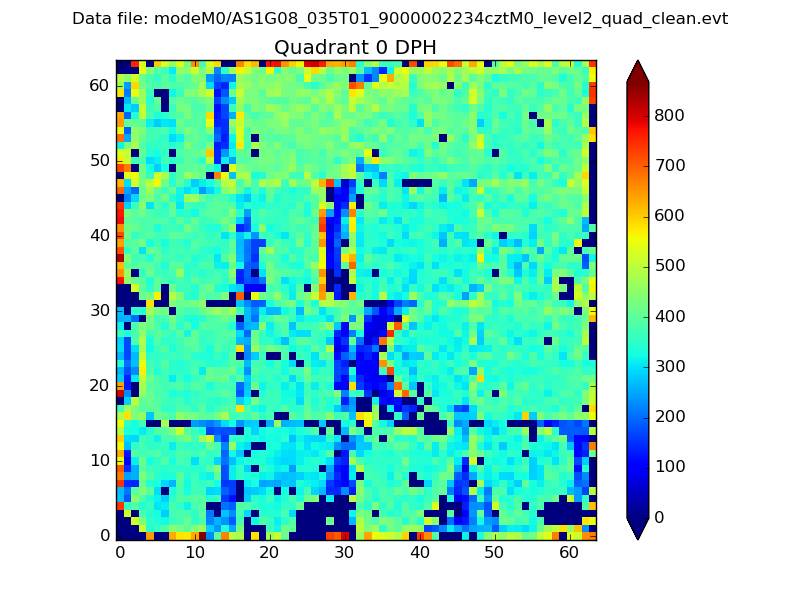 |
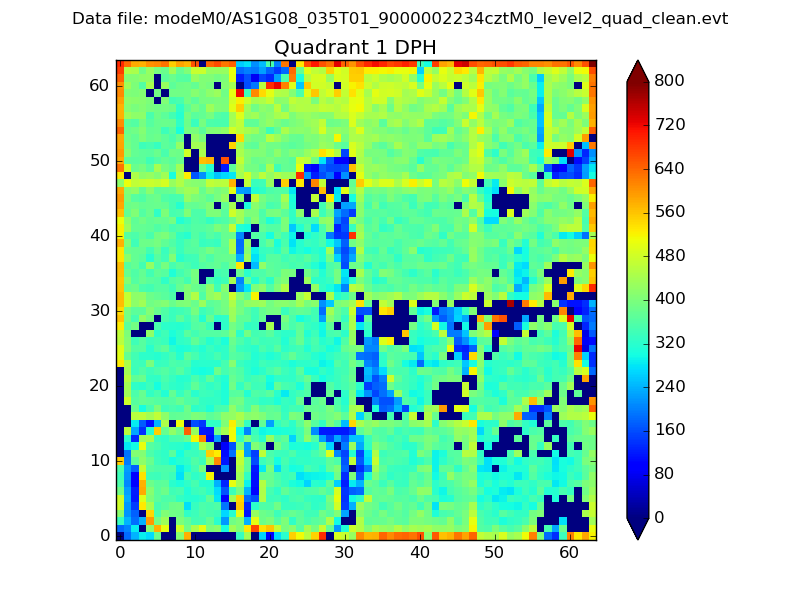 |
Quadrant B |
|---|---|---|---|
| Quadrant D |  |
 |
Quadrant C |
| Plot type | Count rate plots | Images |
|---|---|---|
| Comparison with Poisson distribution Blue bars denote a histogram of data divided into 1 sec bins. Red curve is a Poisson curve with rate = median count rate of data. |
 |
 |
| Quadrant-wise count rates Data is divided into 100 sec bins |
 |
|
| Module-wise count rates for Quadrant A Data is divided into 100 sec bins |
 |
 |
| Module-wise count rates for Quadrant B Data is divided into 100 sec bins |
 |
 |
| Module-wise count rates for Quadrant C Data is divided into 100 sec bins |
 |
 |
| Module-wise count rates for Quadrant D Data is divided into 100 sec bins |
 |
 |
| Parameter | Plot |
|---|---|
| CZT HV Monitor |  |
| D_VDD |  |
| Temperature 1 |  |
| Veto HV Monitor |  |
| Veto LLD |  |
| Alpha Counter |  |
| _CPM_Rate |  |
| CZT Counter |  |
| +2.5 Volts monitor |  |
| +5 Volts monitor | 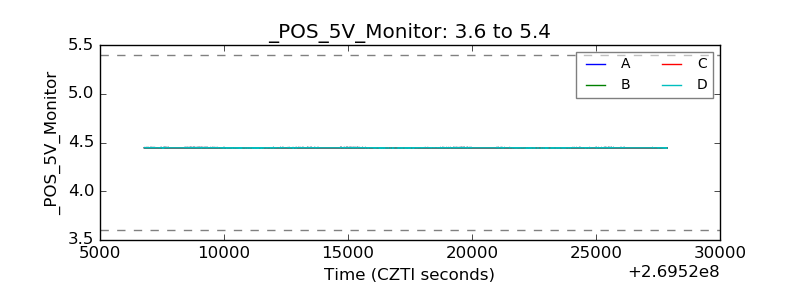 |
| _ROLL_ROT |  |
| _Roll_DEC | 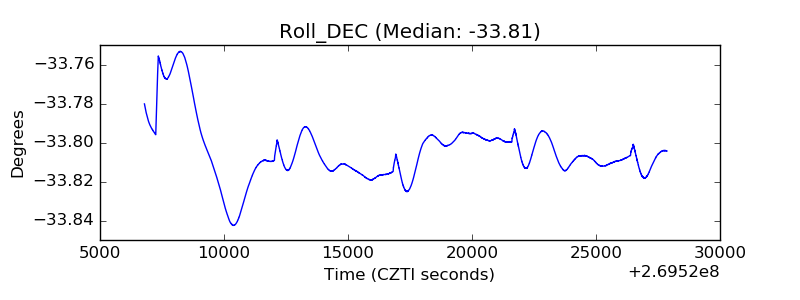 |
| _Roll_RA |  |
| Veto Counter |  |