| Param | Original file | Final file |
|---|---|---|
| Filename | modeM0/AS1A04_218T08_9000002236cztM0_level2_bc.evt | modeM0/AS1A04_218T08_9000002236cztM0_level2_quad_clean.evt |
| Size (bytes) | 3,391,439,040 | 1,350,964,800 |
| Size | 3.2 GB | 1.3 GB |
| Events in quadrant A | 25,813,639 | 8,595,057 |
| Events in quadrant B | 21,979,477 | 8,771,330 |
| Events in quadrant C | 25,402,347 | 8,761,626 |
| Events in quadrant D | 23,086,870 | 8,323,944 |
| Mode M9 | |||
|---|---|---|---|
| Quadrant | BADHDUFLAG | Total packets | Discarded packets |
| A | 0 | 178 | 0 |
| B | 0 | 178 | 0 |
| C | 0 | 178 | 0 |
| D | 0 | 178 | 0 |
| Mode M0 | |||
|---|---|---|---|
| Quadrant | BADHDUFLAG | Total packets | Discarded packets |
| A | 0 | 216208 | 0 |
| B | 0 | 203091 | 0 |
| C | 0 | 210348 | 0 |
| D | 0 | 203765 | 0 |
| Mode SS | |||
|---|---|---|---|
| Quadrant | BADHDUFLAG | Total packets | Discarded packets |
| A | 0 | 1924 | 0 |
| B | 0 | 1924 | 0 |
| C | 0 | 1924 | 0 |
| D | 0 | 1924 | 0 |
| Quadrant | Total seconds | Saturated seconds | Saturation percentage |
|---|---|---|---|
| A | 94399 | 1126 | 1.192809% |
| B | 94399 | 1508 | 1.597475% |
| C | 94399 | 845 | 0.895137% |
| D | 94399 | 1107 | 1.172682% |
Noise dominated data is calculated using 1-second bins in cleaned event files. If a bin has >2000 counts, and if more than 50% of those come from <1% of pixels, then it is considered to be noise-dominated and hence unusable.
| Quadrant | # 1 sec bins | Bins with >0 counts | Bins with >2000 counts | High rate bins dominated by noise | Noise dominated (total time) | Noise dominated (detector-on time) | Marked lightcurve |
|---|---|---|---|---|---|---|---|
| A | 112185 | 94401 | 5 | 5 | 0.00% | 0.01% |  |
| B | 112185 | 94395 | 82 | 82 | 0.07% | 0.09% |  |
| C | 112185 | 94396 | 10 | 10 | 0.01% | 0.01% |  |
| D | 112185 | 94397 | 138 | 138 | 0.12% | 0.15% |  |
Top three noisy pixels from each quadrant. If the there are fewer than three noisy pixels in the level2.evt file, extra rows are filled as -1
| Pixel properties | Quadrant properties | ||||||
|---|---|---|---|---|---|---|---|
| Quadrant | DetID | PixID | Counts | Sigma | Mean | Median | Sigma |
| A | 15 | 239 | 6141731 | 5777.37 | 4873 | 4783 | 1062.2 |
| A | 0 | 253 | 443718 | 413.22 | 4873 | 4783 | 1062.2 |
| A | 12 | 189 | 358429 | 332.92 | 4873 | 4783 | 1062.2 |
| B | 3 | 64 | 1468169 | 1582.62 | 4974 | 4850 | 924.6 |
| B | 0 | 229 | 364815 | 389.31 | 4974 | 4850 | 924.6 |
| B | 4 | 48 | 204224 | 215.63 | 4974 | 4850 | 924.6 |
| C | 3 | 233 | 5959570 | 5517.88 | 4878 | 4820 | 1079.2 |
| C | 9 | 236 | 127786 | 113.94 | 4878 | 4820 | 1079.2 |
| C | 3 | 9 | 125074 | 111.43 | 4878 | 4820 | 1079.2 |
| D | 2 | 16 | 2074256 | 1852.87 | 4850 | 4681 | 1117.0 |
| D | 2 | 33 | 660511 | 587.16 | 4850 | 4681 | 1117.0 |
| D | 10 | 70 | 479737 | 425.31 | 4850 | 4681 | 1117.0 |
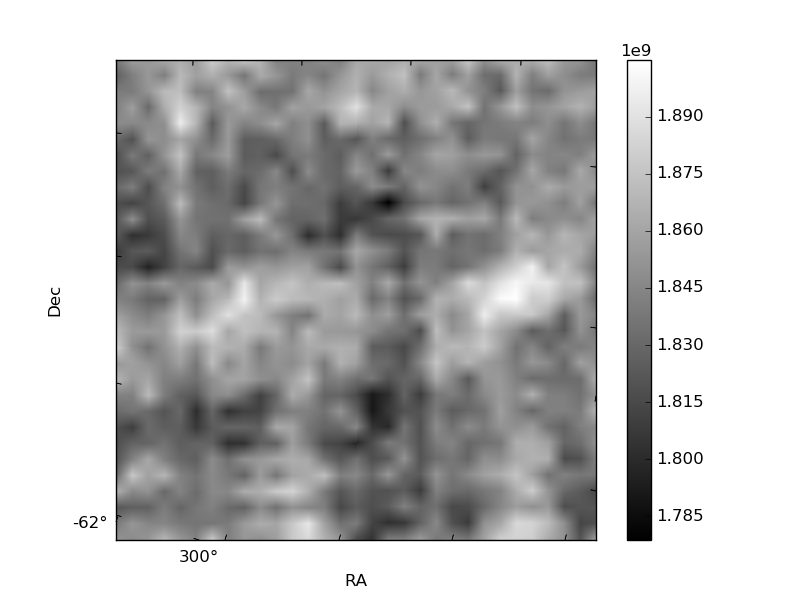
Histogram calculated using DETX and DETY for each event in the final _common_clean file
| Quadrant A |  |
 |
Quadrant B |
|---|---|---|---|
| Quadrant D |  |
 |
Quadrant C |
| Plot type | Count rate plots | Images |
|---|---|---|
| Comparison with Poisson distribution Blue bars denote a histogram of data divided into 1 sec bins. Red curve is a Poisson curve with rate = median count rate of data. |
 |
 |
| Quadrant-wise count rates Data is divided into 100 sec bins |
 |
|
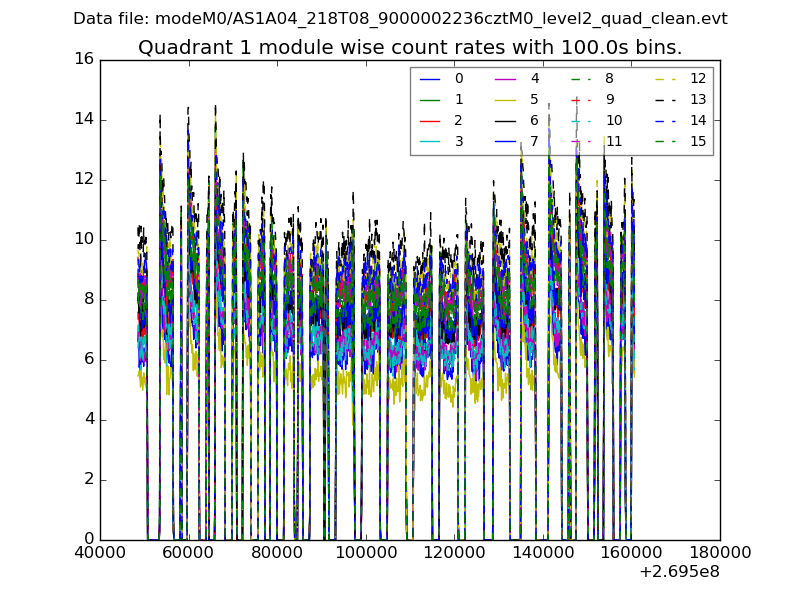
| Module-wise count rates for Quadrant A Data is divided into 100 sec bins |
 |
 |
| Module-wise count rates for Quadrant B Data is divided into 100 sec bins |
 |
 |
| Module-wise count rates for Quadrant C Data is divided into 100 sec bins |
 |
 |
| Module-wise count rates for Quadrant D Data is divided into 100 sec bins |
 |
 |
| Parameter | Plot |
|---|---|
| CZT HV Monitor | 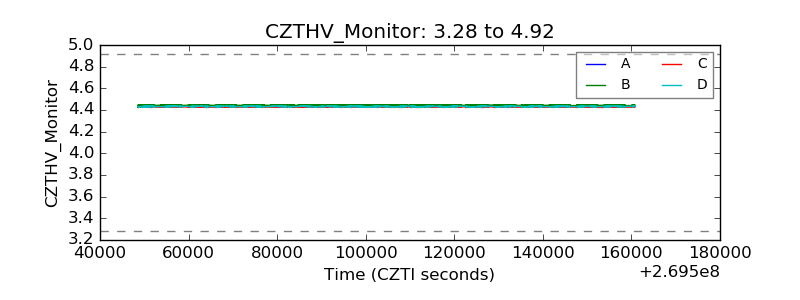 |
| D_VDD |  |
| Temperature 1 |  |
| Veto HV Monitor |  |
| Veto LLD |  |
| Alpha Counter | 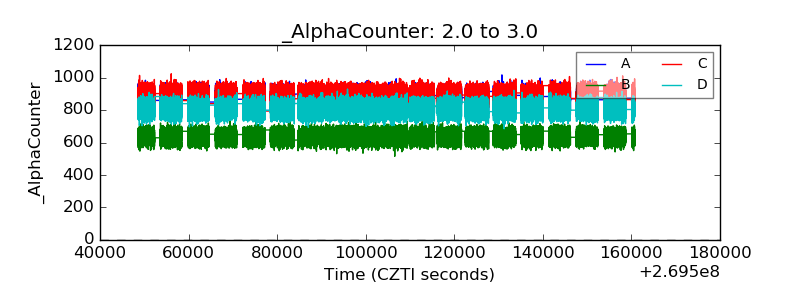 |
| _CPM_Rate |  |
| CZT Counter | 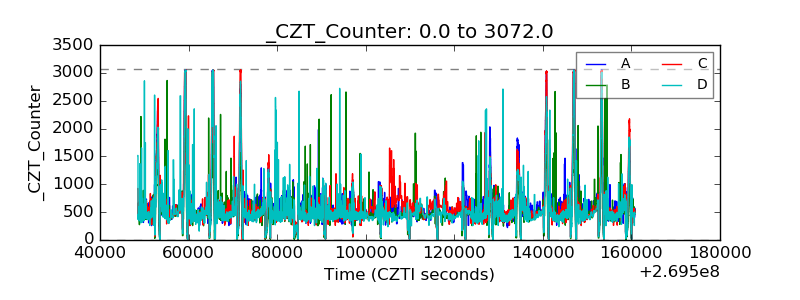 |
| +2.5 Volts monitor | 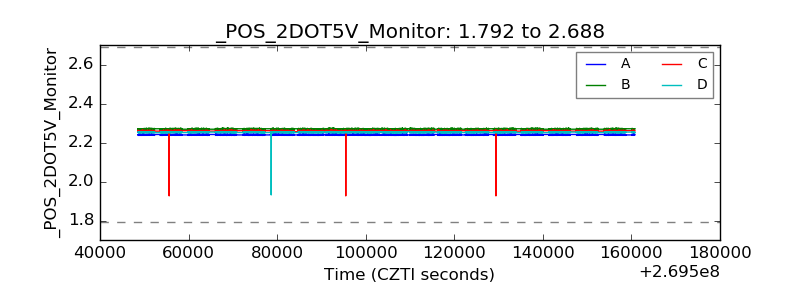 |
| +5 Volts monitor |  |
| _ROLL_ROT | 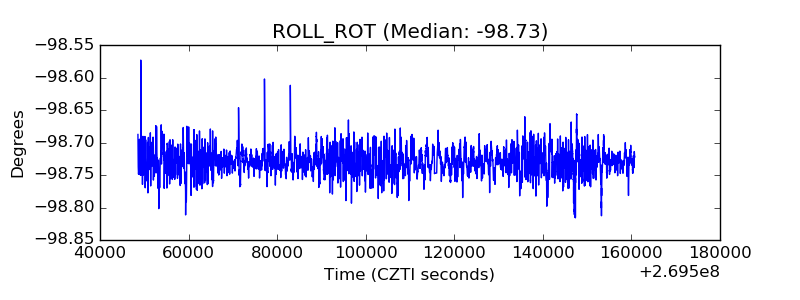 |
| _Roll_DEC |  |
| _Roll_RA | 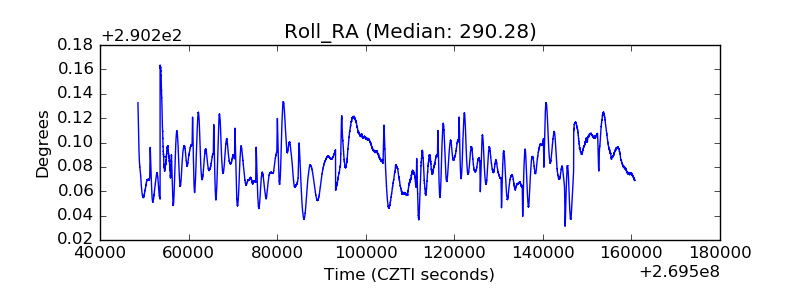 |
| Veto Counter |  |