| Param | Original file | Final file |
|---|---|---|
| Filename | modeM0/AS1C03_015T03_9000002230cztM0_level2_bc.evt | modeM0/AS1C03_015T03_9000002230cztM0_level2_quad_clean.evt |
| Size (bytes) | 218,010,240 | 120,761,280 |
| Size | 207.9 MB | 115.2 MB |
| Events in quadrant A | 1,402,681 | 803,342 |
| Events in quadrant B | 1,516,176 | 814,478 |
| Events in quadrant C | 1,768,508 | 799,122 |
| Events in quadrant D | 1,450,755 | 773,921 |
| Mode SS | |||
|---|---|---|---|
| Quadrant | BADHDUFLAG | Total packets | Discarded packets |
| A | 0 | 138 | 0 |
| B | 0 | 138 | 0 |
| C | 0 | 138 | 0 |
| D | 0 | 138 | 0 |
| Mode M0 | |||
|---|---|---|---|
| Quadrant | BADHDUFLAG | Total packets | Discarded packets |
| A | 0 | 13852 | 0 |
| B | 0 | 14158 | 0 |
| C | 0 | 14982 | 0 |
| D | 0 | 14121 | 0 |
| Mode M9 | |||
|---|---|---|---|
| Quadrant | BADHDUFLAG | Total packets | Discarded packets |
| A | 0 | 9 | 0 |
| B | 0 | 9 | 0 |
| C | 0 | 9 | 0 |
| D | 0 | 9 | 0 |
| Quadrant | Total seconds | Saturated seconds | Saturation percentage |
|---|---|---|---|
| A | 6699 | 75 | 1.119570% |
| B | 6699 | 80 | 1.194208% |
| C | 6699 | 72 | 1.074787% |
| D | 6699 | 111 | 1.656964% |
Noise dominated data is calculated using 1-second bins in cleaned event files. If a bin has >2000 counts, and if more than 50% of those come from <1% of pixels, then it is considered to be noise-dominated and hence unusable.
| Quadrant | # 1 sec bins | Bins with >0 counts | Bins with >2000 counts | High rate bins dominated by noise | Noise dominated (total time) | Noise dominated (detector-on time) | Marked lightcurve |
|---|---|---|---|---|---|---|---|
| A | 7179 | 6699 | 0 | 0 | 0.00% | 0.00% |  |
| B | 7180 | 6699 | 2 | 2 | 0.03% | 0.03% | 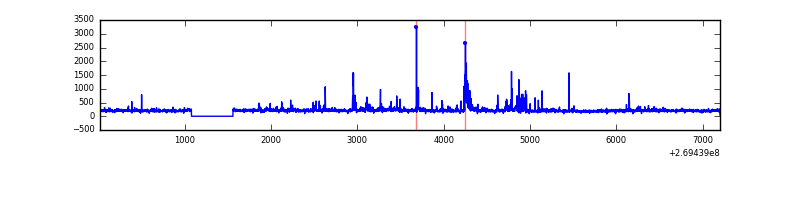 |
| C | 7180 | 6700 | 1 | 1 | 0.01% | 0.01% |  |
| D | 7180 | 6700 | 3 | 3 | 0.04% | 0.04% |  |
Top three noisy pixels from each quadrant. If the there are fewer than three noisy pixels in the level2.evt file, extra rows are filled as -1
| Pixel properties | Quadrant properties | ||||||
|---|---|---|---|---|---|---|---|
| Quadrant | DetID | PixID | Counts | Sigma | Mean | Median | Sigma |
| A | 12 | 189 | 113373 | 1535.47 | 324 | 317 | 73.6 |
| A | 9 | 143 | 20072 | 268.3 | 324 | 317 | 73.6 |
| A | 15 | 239 | 10091 | 132.75 | 324 | 317 | 73.6 |
| B | 3 | 64 | 134571 | 2046.15 | 327 | 317 | 65.6 |
| B | 0 | 230 | 19219 | 288.08 | 327 | 317 | 65.6 |
| B | 0 | 229 | 19000 | 284.75 | 327 | 317 | 65.6 |
| C | 3 | 233 | 516361 | 6989.85 | 316 | 310 | 73.8 |
| C | 0 | 207 | 11164 | 147.02 | 316 | 310 | 73.8 |
| C | 7 | 247 | 2081 | 23.99 | 316 | 310 | 73.8 |
| D | 10 | 70 | 55306 | 713.23 | 319 | 306 | 77.1 |
| D | 7 | 38 | 46247 | 595.75 | 319 | 306 | 77.1 |
| D | 2 | 234 | 26923 | 345.16 | 319 | 306 | 77.1 |
Histogram calculated using DETX and DETY for each event in the final _common_clean file
| Quadrant A | 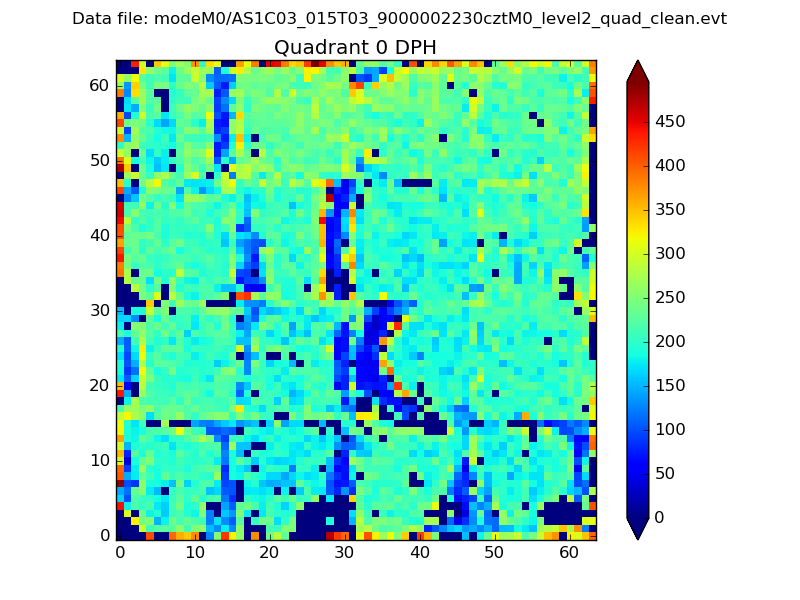 |
 |
Quadrant B |
|---|---|---|---|
| Quadrant D |  |
 |
Quadrant C |
| Plot type | Count rate plots | Images |
|---|---|---|
| Comparison with Poisson distribution Blue bars denote a histogram of data divided into 1 sec bins. Red curve is a Poisson curve with rate = median count rate of data. |
 |
 |
| Quadrant-wise count rates Data is divided into 100 sec bins |
 |
|
| Module-wise count rates for Quadrant A Data is divided into 100 sec bins |
 |
 |
| Module-wise count rates for Quadrant B Data is divided into 100 sec bins |
 |
 |
| Module-wise count rates for Quadrant C Data is divided into 100 sec bins |
 |
 |
| Module-wise count rates for Quadrant D Data is divided into 100 sec bins |
 |
 |
| Parameter | Plot |
|---|---|
| CZT HV Monitor |  |
| D_VDD |  |
| Temperature 1 |  |
| Veto HV Monitor |  |
| Veto LLD | 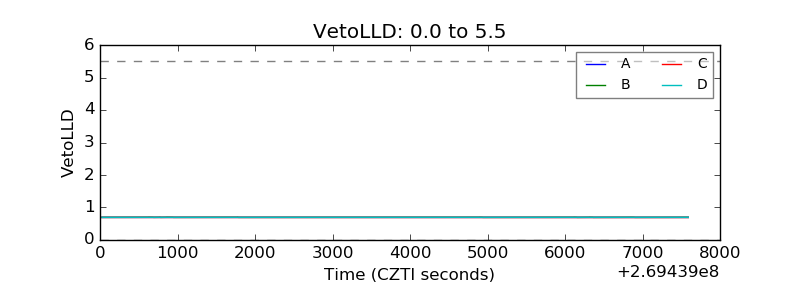 |
| Alpha Counter |  |
| _CPM_Rate |  |
| CZT Counter |  |
| +2.5 Volts monitor |  |
| +5 Volts monitor |  |
| _ROLL_ROT |  |
| _Roll_DEC |  |
| _Roll_RA |  |
| Veto Counter |  |