| Param | Original file | Final file |
|---|---|---|
| Filename | modeM0/AS1A04_218T03_9000002232cztM0_level2_bc.evt | modeM0/AS1A04_218T03_9000002232cztM0_level2_quad_clean.evt |
| Size (bytes) | 2,347,237,440 | 884,039,040 |
| Size | 2.2 GB | 843.1 MB |
| Events in quadrant A | 16,375,018 | 5,594,317 |
| Events in quadrant B | 16,331,535 | 5,696,514 |
| Events in quadrant C | 15,844,914 | 5,625,105 |
| Events in quadrant D | 17,943,810 | 5,242,938 |
| Mode M9 | |||
|---|---|---|---|
| Quadrant | BADHDUFLAG | Total packets | Discarded packets |
| A | 0 | 102 | 0 |
| B | 0 | 102 | 0 |
| C | 0 | 102 | 0 |
| D | 0 | 102 | 0 |
| Mode SS | |||
|---|---|---|---|
| Quadrant | BADHDUFLAG | Total packets | Discarded packets |
| A | 0 | 1372 | 0 |
| B | 0 | 1372 | 0 |
| C | 0 | 1372 | 0 |
| D | 0 | 1372 | 0 |
| Mode M0 | |||
|---|---|---|---|
| Quadrant | BADHDUFLAG | Total packets | Discarded packets |
| A | 0 | 147027 | 0 |
| B | 0 | 149403 | 0 |
| C | 0 | 143456 | 0 |
| D | 0 | 154893 | 0 |
| Quadrant | Total seconds | Saturated seconds | Saturation percentage |
|---|---|---|---|
| A | 67323 | 1064 | 1.580441% |
| B | 67323 | 2071 | 3.076215% |
| C | 67323 | 758 | 1.125915% |
| D | 67323 | 2401 | 3.566389% |
Noise dominated data is calculated using 1-second bins in cleaned event files. If a bin has >2000 counts, and if more than 50% of those come from <1% of pixels, then it is considered to be noise-dominated and hence unusable.
| Quadrant | # 1 sec bins | Bins with >0 counts | Bins with >2000 counts | High rate bins dominated by noise | Noise dominated (total time) | Noise dominated (detector-on time) | Marked lightcurve |
|---|---|---|---|---|---|---|---|
| A | 77709 | 67328 | 2 | 2 | 0.00% | 0.00% |  |
| B | 77709 | 67330 | 241 | 241 | 0.31% | 0.36% | 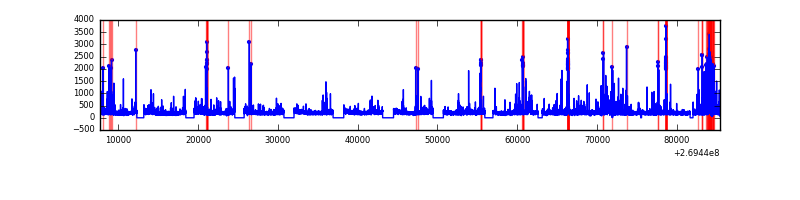 |
| C | 77709 | 67331 | 0 | 0 | 0.00% | 0.00% |  |
| D | 77709 | 67329 | 445 | 445 | 0.57% | 0.66% |  |
Top three noisy pixels from each quadrant. If the there are fewer than three noisy pixels in the level2.evt file, extra rows are filled as -1
| Pixel properties | Quadrant properties | ||||||
|---|---|---|---|---|---|---|---|
| Quadrant | DetID | PixID | Counts | Sigma | Mean | Median | Sigma |
| A | 15 | 239 | 1582145 | 2085.93 | 3506 | 3434 | 756.8 |
| A | 12 | 189 | 835110 | 1098.88 | 3506 | 3434 | 756.8 |
| A | 11 | 29 | 261322 | 340.74 | 3506 | 3434 | 756.8 |
| B | 3 | 64 | 1933238 | 2963.01 | 3526 | 3433 | 651.3 |
| B | 3 | 209 | 100228 | 148.62 | 3526 | 3433 | 651.3 |
| B | 10 | 246 | 94499 | 139.82 | 3526 | 3433 | 651.3 |
| C | 3 | 233 | 2181092 | 2884.08 | 3472 | 3427 | 755.1 |
| C | 7 | 247 | 28375 | 33.04 | 3472 | 3427 | 755.1 |
| C | 13 | 61 | 20329 | 22.38 | 3472 | 3427 | 755.1 |
| D | 7 | 223 | 2770726 | 3491.05 | 3440 | 3312 | 792.7 |
| D | 10 | 70 | 389795 | 487.54 | 3440 | 3312 | 792.7 |
| D | 2 | 234 | 247947 | 308.6 | 3440 | 3312 | 792.7 |
Histogram calculated using DETX and DETY for each event in the final _common_clean file
| Quadrant A |  |
 |
Quadrant B |
|---|---|---|---|
| Quadrant D |  |
 |
Quadrant C |
| Plot type | Count rate plots | Images |
|---|---|---|
| Comparison with Poisson distribution Blue bars denote a histogram of data divided into 1 sec bins. Red curve is a Poisson curve with rate = median count rate of data. |
 |
 |
| Quadrant-wise count rates Data is divided into 100 sec bins |
 |
|
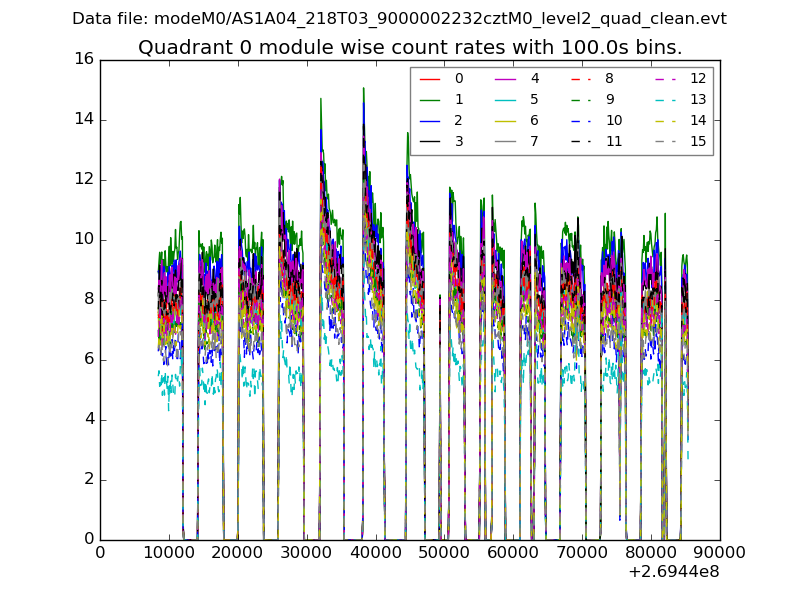
| Module-wise count rates for Quadrant A Data is divided into 100 sec bins |
 |
 |
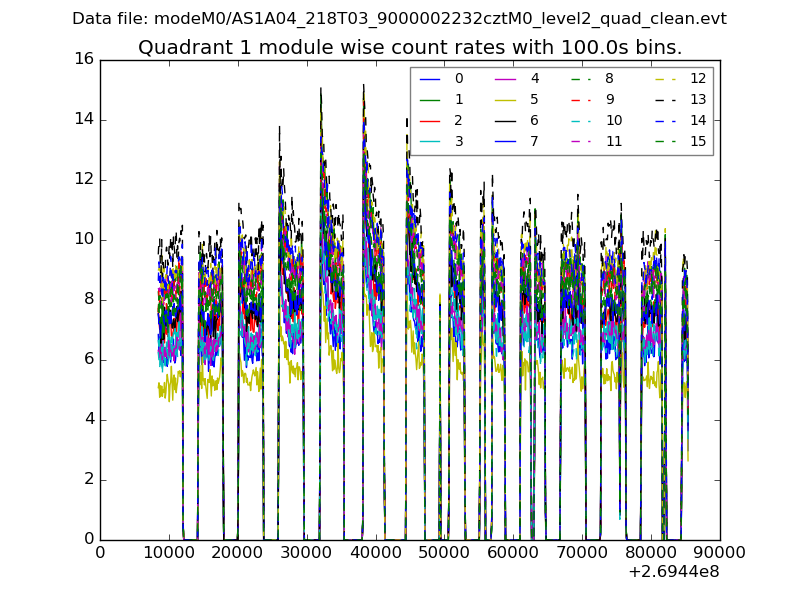
| Module-wise count rates for Quadrant B Data is divided into 100 sec bins |
 |
 |
| Module-wise count rates for Quadrant C Data is divided into 100 sec bins |
 |
 |
| Module-wise count rates for Quadrant D Data is divided into 100 sec bins |
 |
 |
| Parameter | Plot |
|---|---|
| CZT HV Monitor |  |
| D_VDD |  |
| Temperature 1 |  |
| Veto HV Monitor | 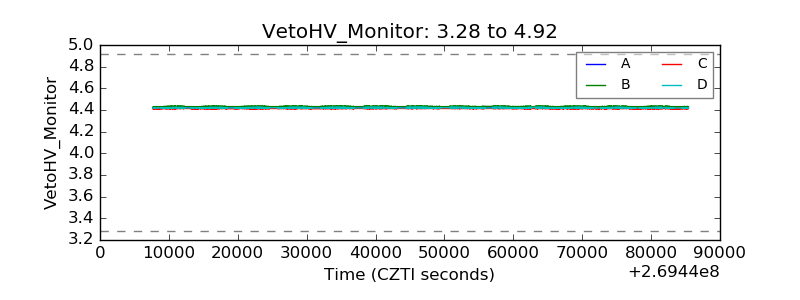 |
| Veto LLD |  |
| Alpha Counter |  |
| _CPM_Rate | 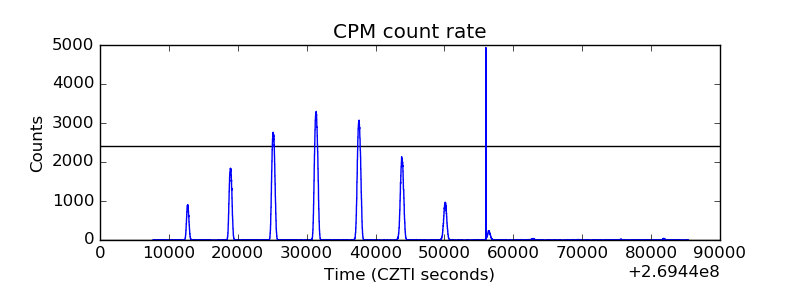 |
| CZT Counter |  |
| +2.5 Volts monitor |  |
| +5 Volts monitor |  |
| _ROLL_ROT |  |
| _Roll_DEC |  |
| _Roll_RA |  |
| Veto Counter |  |