| Param | Original file | Final file |
|---|---|---|
| Filename | modeM0/AS1G08_046T09_9000002226cztM0_level2_bc.evt | modeM0/AS1G08_046T09_9000002226cztM0_level2_quad_clean.evt |
| Size (bytes) | 2,534,892,480 | 867,409,920 |
| Size | 2.4 GB | 827.2 MB |
| Events in quadrant A | 14,219,369 | 5,558,041 |
| Events in quadrant B | 20,508,747 | 5,515,928 |
| Events in quadrant C | 21,503,914 | 5,388,808 |
| Events in quadrant D | 15,980,775 | 5,224,477 |
| Mode M0 | |||
|---|---|---|---|
| Quadrant | BADHDUFLAG | Total packets | Discarded packets |
| A | 0 | 138809 | 0 |
| B | 0 | 163221 | 0 |
| C | 0 | 164928 | 0 |
| D | 0 | 146110 | 0 |
| Mode M9 | |||
|---|---|---|---|
| Quadrant | BADHDUFLAG | Total packets | Discarded packets |
| A | 0 | 116 | 0 |
| B | 0 | 116 | 0 |
| C | 0 | 116 | 0 |
| D | 0 | 116 | 0 |
| Mode SS | |||
|---|---|---|---|
| Quadrant | BADHDUFLAG | Total packets | Discarded packets |
| A | 0 | 1364 | 0 |
| B | 0 | 1364 | 0 |
| C | 0 | 1364 | 0 |
| D | 0 | 1364 | 0 |
| Quadrant | Total seconds | Saturated seconds | Saturation percentage |
|---|---|---|---|
| A | 66859 | 690 | 1.032023% |
| B | 66859 | 2974 | 4.448167% |
| C | 66859 | 1757 | 2.627918% |
| D | 66859 | 1381 | 2.065541% |
Noise dominated data is calculated using 1-second bins in cleaned event files. If a bin has >2000 counts, and if more than 50% of those come from <1% of pixels, then it is considered to be noise-dominated and hence unusable.
| Quadrant | # 1 sec bins | Bins with >0 counts | Bins with >2000 counts | High rate bins dominated by noise | Noise dominated (total time) | Noise dominated (detector-on time) | Marked lightcurve |
|---|---|---|---|---|---|---|---|
| A | 78540 | 66860 | 6 | 6 | 0.01% | 0.01% |  |
| B | 78540 | 66856 | 228 | 228 | 0.29% | 0.34% | 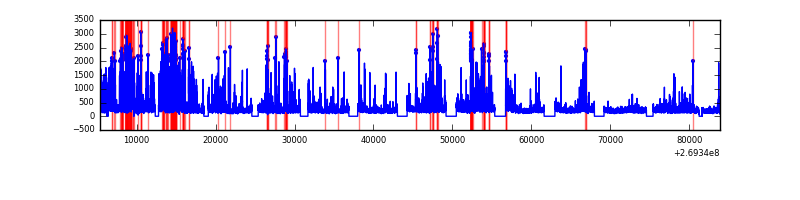 |
| C | 78540 | 66857 | 40 | 40 | 0.05% | 0.06% |  |
| D | 78540 | 66861 | 416 | 416 | 0.53% | 0.62% |  |
Top three noisy pixels from each quadrant. If the there are fewer than three noisy pixels in the level2.evt file, extra rows are filled as -1
| Pixel properties | Quadrant properties | ||||||
|---|---|---|---|---|---|---|---|
| Quadrant | DetID | PixID | Counts | Sigma | Mean | Median | Sigma |
| A | 12 | 189 | 699810 | 935.6 | 3429 | 3362 | 744.4 |
| A | 9 | 143 | 104635 | 136.05 | 3429 | 3362 | 744.4 |
| A | 15 | 239 | 103289 | 134.24 | 3429 | 3362 | 744.4 |
| B | 10 | 245 | 3581210 | 5672.3 | 3419 | 3334 | 630.8 |
| B | 3 | 64 | 2794574 | 4425.18 | 3419 | 3334 | 630.8 |
| B | 3 | 209 | 181883 | 283.07 | 3419 | 3334 | 630.8 |
| C | 3 | 233 | 6320485 | 8610.46 | 3336 | 3300 | 733.7 |
| C | 4 | 254 | 1844407 | 2509.47 | 3336 | 3300 | 733.7 |
| C | 0 | 207 | 111635 | 147.66 | 3336 | 3300 | 733.7 |
| D | 1 | 255 | 1119107 | 1422.06 | 3361 | 3238 | 784.7 |
| D | 2 | 33 | 565441 | 716.47 | 3361 | 3238 | 784.7 |
| D | 2 | 234 | 249548 | 313.9 | 3361 | 3238 | 784.7 |
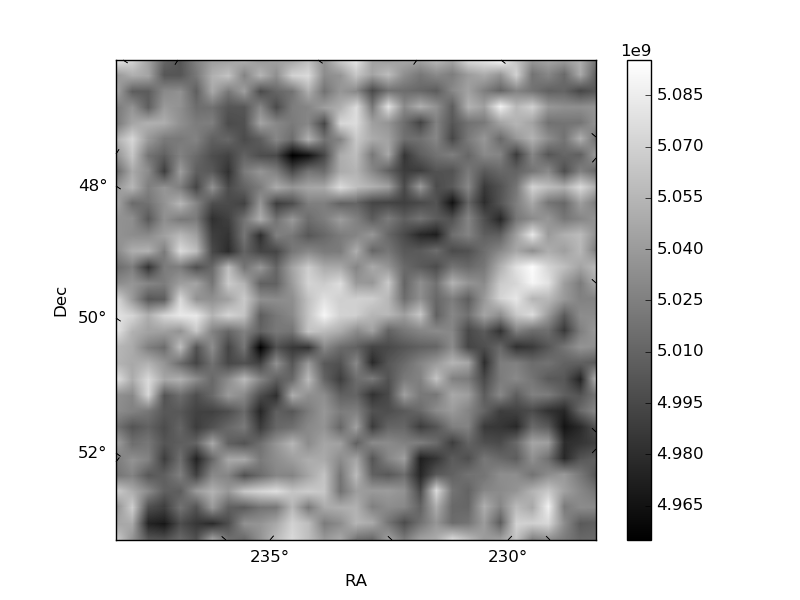
Histogram calculated using DETX and DETY for each event in the final _common_clean file
| Quadrant A |  |
 |
Quadrant B |
|---|---|---|---|
| Quadrant D |  |
 |
Quadrant C |
| Plot type | Count rate plots | Images |
|---|---|---|
| Comparison with Poisson distribution Blue bars denote a histogram of data divided into 1 sec bins. Red curve is a Poisson curve with rate = median count rate of data. |
 |
 |
| Quadrant-wise count rates Data is divided into 100 sec bins |
 |
|
| Module-wise count rates for Quadrant A Data is divided into 100 sec bins |
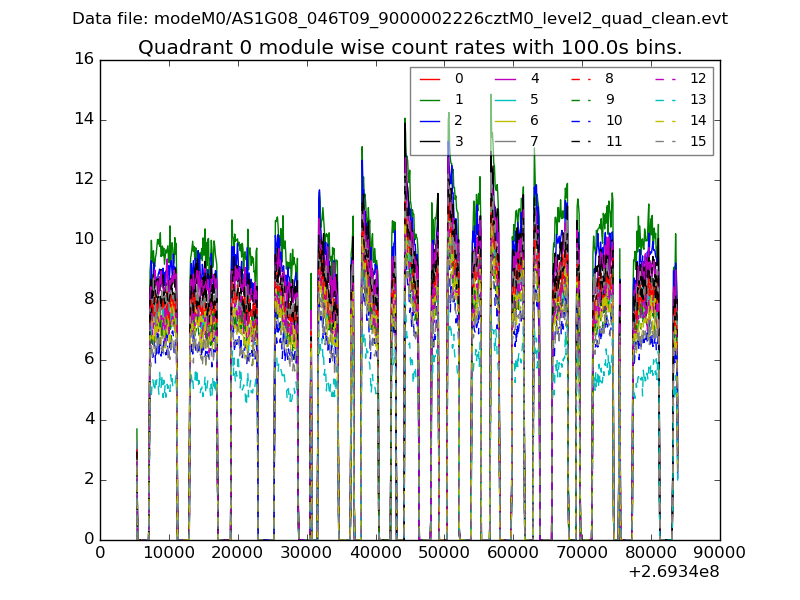 |
 |
| Module-wise count rates for Quadrant B Data is divided into 100 sec bins |
 |
 |
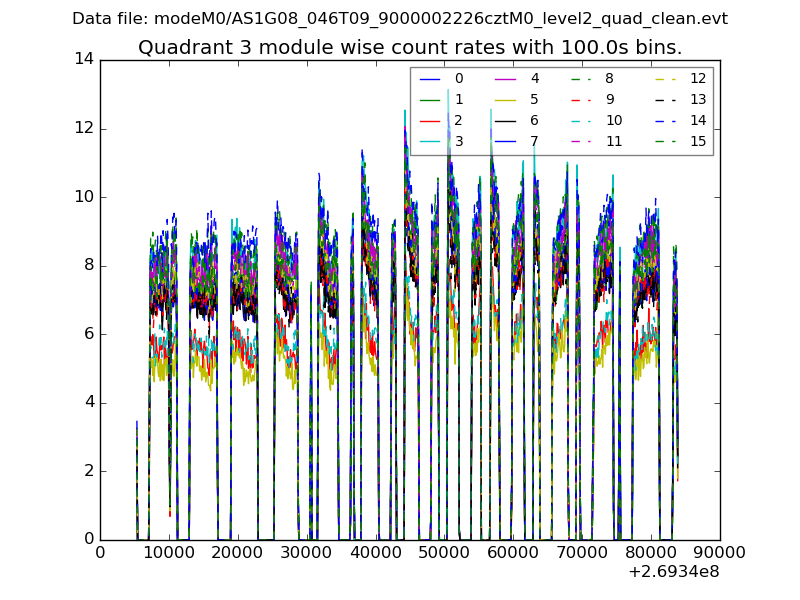
| Module-wise count rates for Quadrant C Data is divided into 100 sec bins |
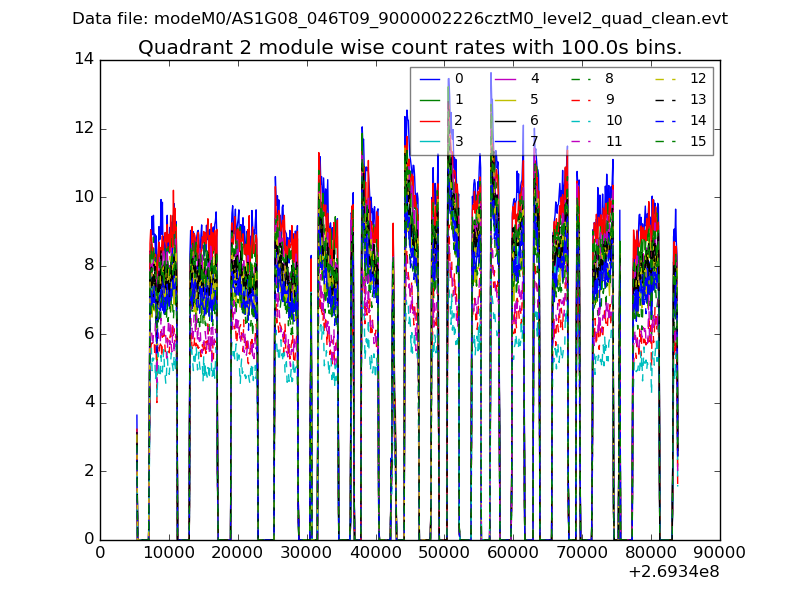 |
 |
| Module-wise count rates for Quadrant D Data is divided into 100 sec bins |
 |
 |
| Parameter | Plot |
|---|---|
| CZT HV Monitor |  |
| D_VDD |  |
| Temperature 1 |  |
| Veto HV Monitor |  |
| Veto LLD |  |
| Alpha Counter |  |
| _CPM_Rate |  |
| CZT Counter |  |
| +2.5 Volts monitor |  |
| +5 Volts monitor |  |
| _ROLL_ROT | 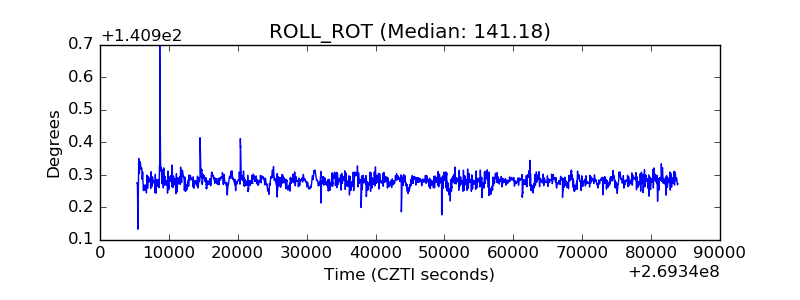 |
| _Roll_DEC | 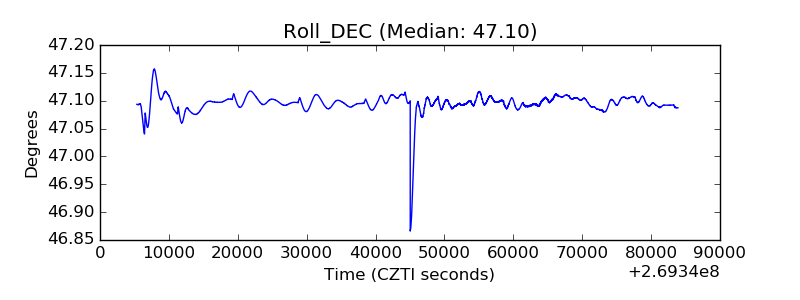 |
| _Roll_RA | 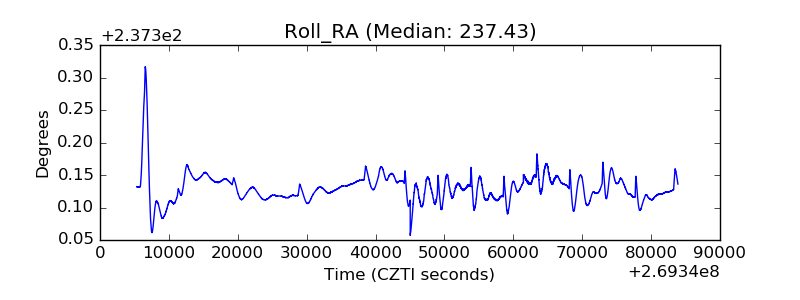 |
| Veto Counter |  |