| Param | Original file | Final file |
|---|---|---|
| Filename | modeM0/AS1A04_148T03_9000002222cztM0_level2_bc.evt | modeM0/AS1A04_148T03_9000002222cztM0_level2_quad_clean.evt |
| Size (bytes) | 600,315,840 | 239,189,760 |
| Size | 572.5 MB | 228.1 MB |
| Events in quadrant A | 3,232,638 | 1,557,592 |
| Events in quadrant B | 5,596,896 | 1,559,217 |
| Events in quadrant C | 4,989,015 | 1,558,315 |
| Events in quadrant D | 3,318,234 | 1,518,640 |
| Mode SS | |||
|---|---|---|---|
| Quadrant | BADHDUFLAG | Total packets | Discarded packets |
| A | 0 | 310 | 0 |
| B | 0 | 310 | 0 |
| C | 0 | 310 | 0 |
| D | 0 | 310 | 0 |
| Mode M9 | |||
|---|---|---|---|
| Quadrant | BADHDUFLAG | Total packets | Discarded packets |
| A | 0 | 35 | 0 |
| B | 0 | 35 | 0 |
| C | 0 | 35 | 0 |
| D | 0 | 35 | 0 |
| Mode M0 | |||
|---|---|---|---|
| Quadrant | BADHDUFLAG | Total packets | Discarded packets |
| A | 0 | 31941 | 0 |
| B | 0 | 40066 | 0 |
| C | 0 | 37931 | 0 |
| D | 0 | 32194 | 0 |
| Quadrant | Total seconds | Saturated seconds | Saturation percentage |
|---|---|---|---|
| A | 15232 | 88 | 0.577731% |
| B | 15232 | 652 | 4.280462% |
| C | 15232 | 436 | 2.862395% |
| D | 15232 | 96 | 0.630252% |
Noise dominated data is calculated using 1-second bins in cleaned event files. If a bin has >2000 counts, and if more than 50% of those come from <1% of pixels, then it is considered to be noise-dominated and hence unusable.
| Quadrant | # 1 sec bins | Bins with >0 counts | Bins with >2000 counts | High rate bins dominated by noise | Noise dominated (total time) | Noise dominated (detector-on time) | Marked lightcurve |
|---|---|---|---|---|---|---|---|
| A | 18728 | 15231 | 0 | 0 | 0.00% | 0.00% |  |
| B | 18728 | 15234 | 59 | 59 | 0.32% | 0.39% |  |
| C | 18728 | 15229 | 47 | 47 | 0.25% | 0.31% |  |
| D | 18728 | 15231 | 9 | 9 | 0.05% | 0.06% |  |
Top three noisy pixels from each quadrant. If the there are fewer than three noisy pixels in the level2.evt file, extra rows are filled as -1
| Pixel properties | Quadrant properties | ||||||
|---|---|---|---|---|---|---|---|
| Quadrant | DetID | PixID | Counts | Sigma | Mean | Median | Sigma |
| A | 12 | 189 | 117273 | 672.68 | 798 | 783 | 173.2 |
| A | 13 | 248 | 15800 | 86.72 | 798 | 783 | 173.2 |
| A | 9 | 143 | 13821 | 75.29 | 798 | 783 | 173.2 |
| B | 3 | 64 | 1007793 | 6633.1 | 798 | 778 | 151.8 |
| B | 10 | 245 | 998673 | 6573.03 | 798 | 778 | 151.8 |
| B | 0 | 229 | 305051 | 2004.21 | 798 | 778 | 151.8 |
| C | 4 | 254 | 1011488 | 5799.02 | 785 | 776 | 174.3 |
| C | 3 | 233 | 896153 | 5137.28 | 785 | 776 | 174.3 |
| C | 8 | 222 | 6233 | 31.31 | 785 | 776 | 174.3 |
| D | 2 | 234 | 60646 | 321.92 | 794 | 767 | 186.0 |
| D | 2 | 120 | 49990 | 264.63 | 794 | 767 | 186.0 |
| D | 9 | 1 | 43878 | 231.77 | 794 | 767 | 186.0 |
Histogram calculated using DETX and DETY for each event in the final _common_clean file
| Quadrant A |  |
 |
Quadrant B |
|---|---|---|---|
| Quadrant D |  |
 |
Quadrant C |
| Plot type | Count rate plots | Images |
|---|---|---|
| Comparison with Poisson distribution Blue bars denote a histogram of data divided into 1 sec bins. Red curve is a Poisson curve with rate = median count rate of data. |
 |
 |
| Quadrant-wise count rates Data is divided into 100 sec bins |
 |
|
| Module-wise count rates for Quadrant A Data is divided into 100 sec bins |
 |
 |
| Module-wise count rates for Quadrant B Data is divided into 100 sec bins |
 |
 |
| Module-wise count rates for Quadrant C Data is divided into 100 sec bins |
 |
 |
| Module-wise count rates for Quadrant D Data is divided into 100 sec bins |
 |
 |
| Parameter | Plot |
|---|---|
| CZT HV Monitor |  |
| D_VDD |  |
| Temperature 1 | 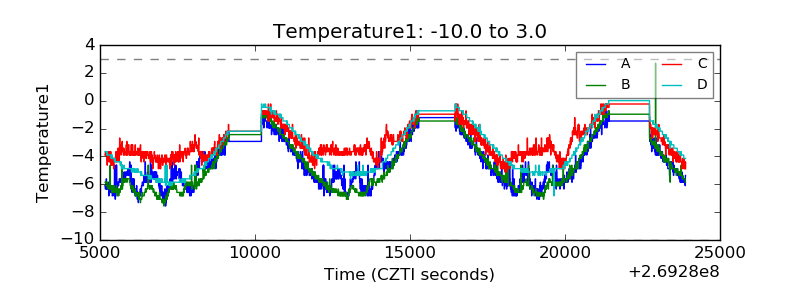 |
| Veto HV Monitor |  |
| Veto LLD |  |
| Alpha Counter |  |
| _CPM_Rate |  |
| CZT Counter | 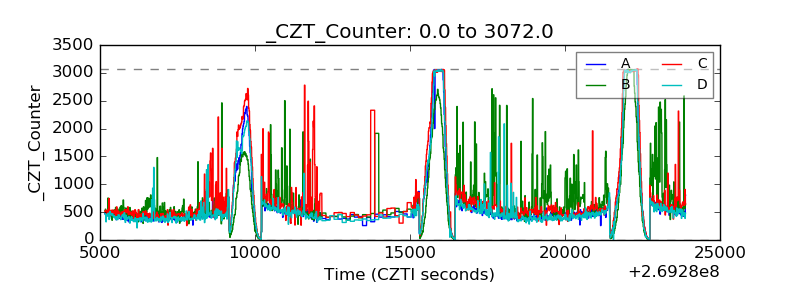 |
| +2.5 Volts monitor |  |
| +5 Volts monitor |  |
| _ROLL_ROT |  |
| _Roll_DEC |  |
| _Roll_RA |  |
| Veto Counter |  |