| Param | Original file | Final file |
|---|---|---|
| Filename | modeM0/AS1A04_130T03_9000002224cztM0_level2_bc.evt | modeM0/AS1A04_130T03_9000002224cztM0_level2_quad_clean.evt |
| Size (bytes) | 1,333,154,880 | 406,235,520 |
| Size | 1.2 GB | 387.4 MB |
| Events in quadrant A | 7,192,790 | 2,524,599 |
| Events in quadrant B | 13,572,655 | 2,516,880 |
| Events in quadrant C | 9,652,560 | 2,532,721 |
| Events in quadrant D | 7,674,017 | 2,431,594 |
| Mode SS | |||
|---|---|---|---|
| Quadrant | BADHDUFLAG | Total packets | Discarded packets |
| A | 0 | 680 | 0 |
| B | 0 | 680 | 0 |
| C | 0 | 680 | 0 |
| D | 0 | 680 | 0 |
| Mode M9 | |||
|---|---|---|---|
| Quadrant | BADHDUFLAG | Total packets | Discarded packets |
| A | 0 | 55 | 0 |
| B | 0 | 55 | 0 |
| C | 0 | 55 | 0 |
| D | 0 | 55 | 0 |
| Mode M0 | |||
|---|---|---|---|
| Quadrant | BADHDUFLAG | Total packets | Discarded packets |
| A | 0 | 70079 | 0 |
| B | 0 | 94697 | 0 |
| C | 0 | 77225 | 0 |
| D | 0 | 71374 | 0 |
| Quadrant | Total seconds | Saturated seconds | Saturation percentage |
|---|---|---|---|
| A | 33435 | 658 | 1.967998% |
| B | 33435 | 2815 | 8.419321% |
| C | 33435 | 722 | 2.159414% |
| D | 33435 | 576 | 1.722746% |
Noise dominated data is calculated using 1-second bins in cleaned event files. If a bin has >2000 counts, and if more than 50% of those come from <1% of pixels, then it is considered to be noise-dominated and hence unusable.
| Quadrant | # 1 sec bins | Bins with >0 counts | Bins with >2000 counts | High rate bins dominated by noise | Noise dominated (total time) | Noise dominated (detector-on time) | Marked lightcurve |
|---|---|---|---|---|---|---|---|
| A | 38977 | 33437 | 12 | 12 | 0.03% | 0.04% |  |
| B | 38977 | 33434 | 382 | 382 | 0.98% | 1.14% | 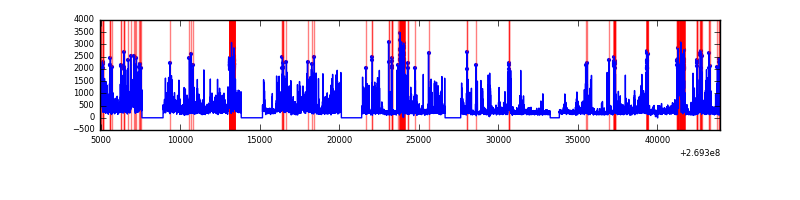 |
| C | 38977 | 33437 | 22 | 22 | 0.06% | 0.07% | 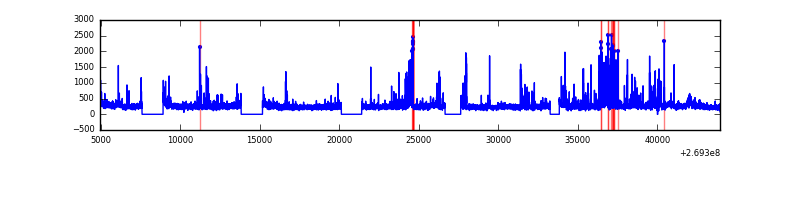 |
| D | 38977 | 33436 | 9 | 9 | 0.02% | 0.03% |  |
Top three noisy pixels from each quadrant. If the there are fewer than three noisy pixels in the level2.evt file, extra rows are filled as -1
| Pixel properties | Quadrant properties | ||||||
|---|---|---|---|---|---|---|---|
| Quadrant | DetID | PixID | Counts | Sigma | Mean | Median | Sigma |
| A | 12 | 189 | 113243 | 292.87 | 1779 | 1743 | 380.7 |
| A | 15 | 69 | 74680 | 191.58 | 1779 | 1743 | 380.7 |
| A | 13 | 248 | 53562 | 136.11 | 1779 | 1743 | 380.7 |
| B | 10 | 245 | 4555592 | 14024.77 | 1744 | 1700 | 324.7 |
| B | 3 | 64 | 1700684 | 5232.42 | 1744 | 1700 | 324.7 |
| B | 0 | 229 | 306195 | 937.76 | 1744 | 1700 | 324.7 |
| C | 3 | 233 | 1669495 | 4336.02 | 1764 | 1741 | 384.6 |
| C | 4 | 254 | 1046368 | 2715.94 | 1764 | 1741 | 384.6 |
| C | 7 | 247 | 16337 | 37.95 | 1764 | 1741 | 384.6 |
| D | 2 | 14 | 264761 | 650.52 | 1777 | 1715 | 404.4 |
| D | 2 | 152 | 139364 | 340.41 | 1777 | 1715 | 404.4 |
| D | 2 | 234 | 130512 | 318.52 | 1777 | 1715 | 404.4 |
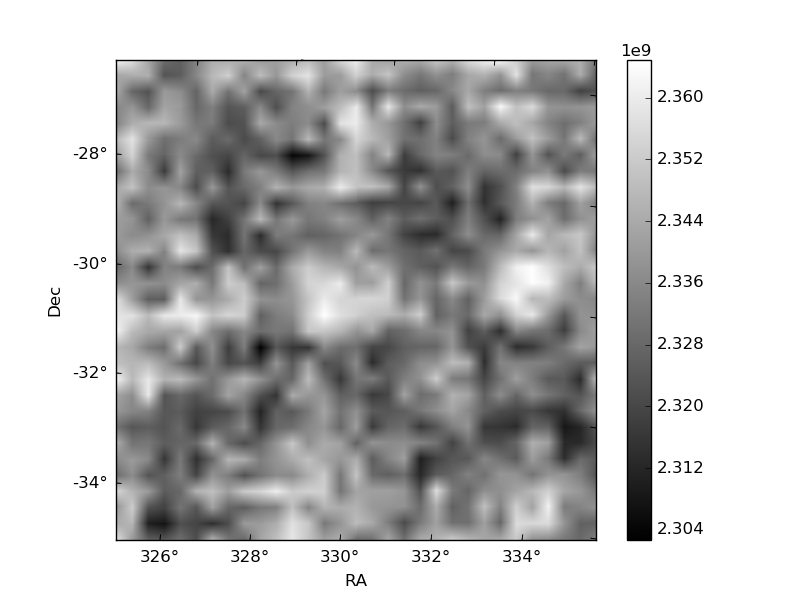
Histogram calculated using DETX and DETY for each event in the final _common_clean file
| Quadrant A |  |
 |
Quadrant B |
|---|---|---|---|
| Quadrant D | 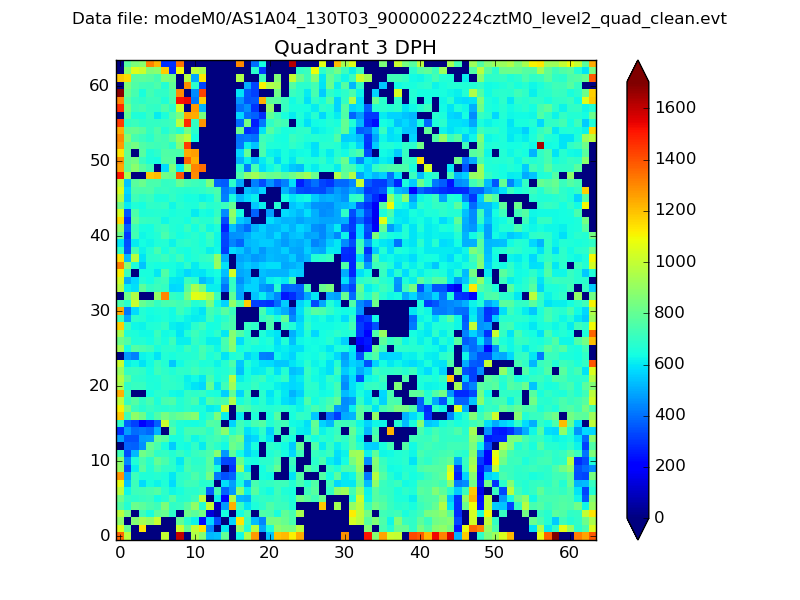 |
 |
Quadrant C |
| Plot type | Count rate plots | Images |
|---|---|---|
| Comparison with Poisson distribution Blue bars denote a histogram of data divided into 1 sec bins. Red curve is a Poisson curve with rate = median count rate of data. |
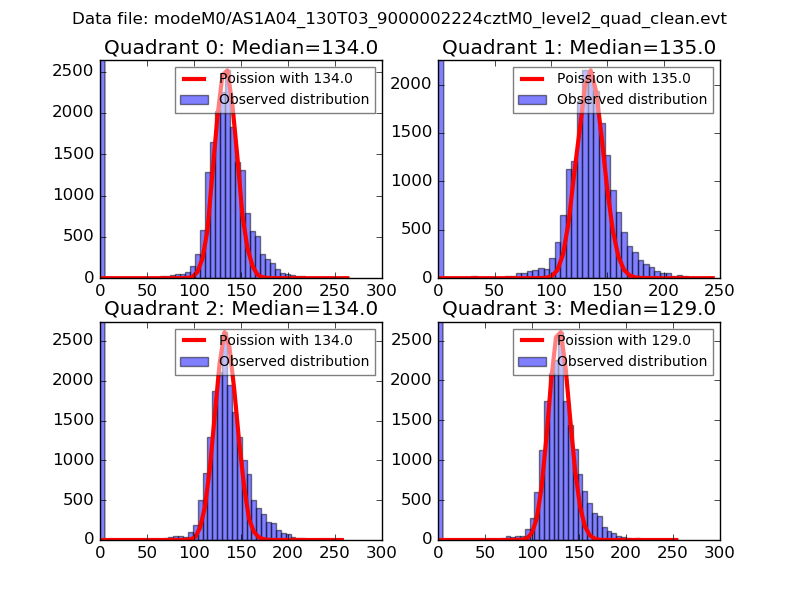 |
 |
| Quadrant-wise count rates Data is divided into 100 sec bins |
 |
|
| Module-wise count rates for Quadrant A Data is divided into 100 sec bins |
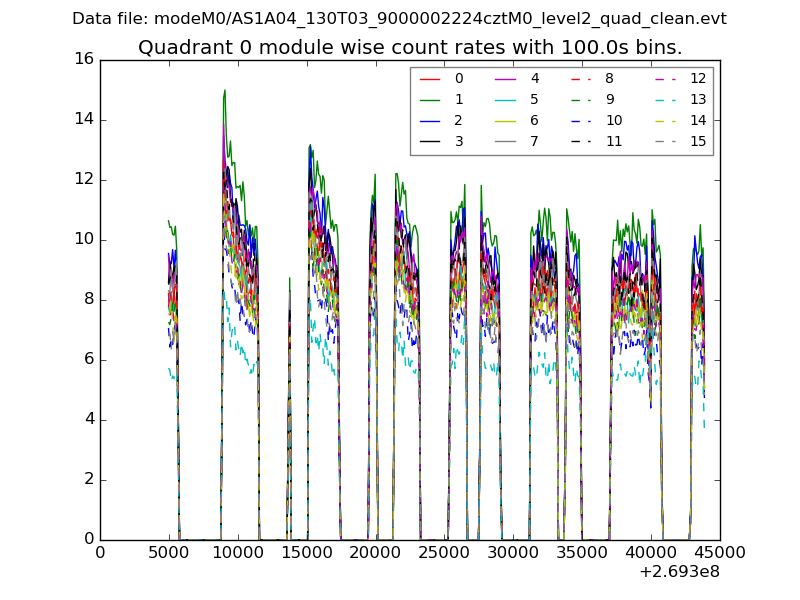 |
 |
| Module-wise count rates for Quadrant B Data is divided into 100 sec bins |
 |
 |
| Module-wise count rates for Quadrant C Data is divided into 100 sec bins |
 |
 |
| Module-wise count rates for Quadrant D Data is divided into 100 sec bins |
 |
 |
| Parameter | Plot |
|---|---|
| CZT HV Monitor |  |
| D_VDD |  |
| Temperature 1 | 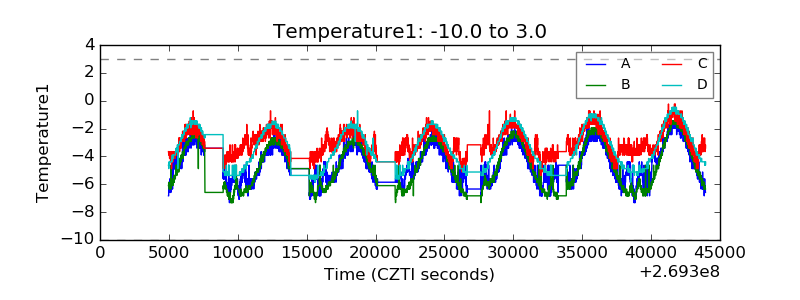 |
| Veto HV Monitor |  |
| Veto LLD | 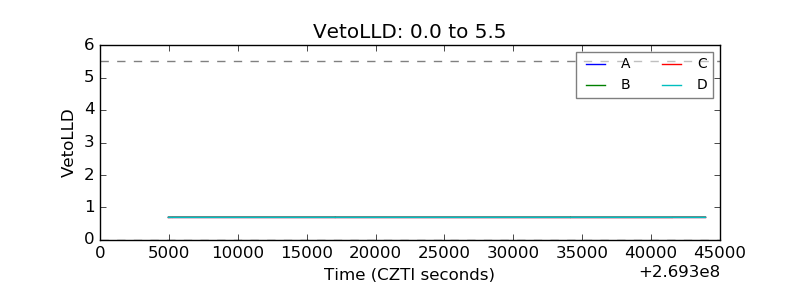 |
| Alpha Counter |  |
| _CPM_Rate |  |
| CZT Counter |  |
| +2.5 Volts monitor |  |
| +5 Volts monitor |  |
| _ROLL_ROT |  |
| _Roll_DEC | 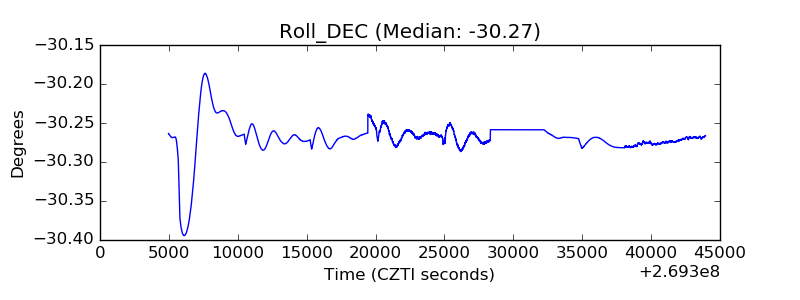 |
| _Roll_RA |  |
| Veto Counter |  |